Gathering detailed insights and metrics for @angular-extensions/pretty-html-log
Gathering detailed insights and metrics for @angular-extensions/pretty-html-log
Gathering detailed insights and metrics for @angular-extensions/pretty-html-log
Gathering detailed insights and metrics for @angular-extensions/pretty-html-log
A module that allows you to pretty print the inner HTML of ComponentFixtures, DebugElements, NativeElements or even plain HTML strings to the console. This is very useful for debugging Angular component tests in Jest
npm install @angular-extensions/pretty-html-logTypescript
Module System
Node Version
NPM Version
TypeScript (98.88%)
JavaScript (1.12%)
Total Downloads
0
Last Day
0
Last Week
0
Last Month
0
Last Year
0
MIT License
38 Stars
134 Commits
3 Watchers
18 Branches
5 Contributors
Updated on Apr 21, 2025
Latest Version
5.1.1
Package Id
@angular-extensions/pretty-html-log@5.1.1
Unpacked Size
59.56 kB
Size
21.28 kB
File Count
23
NPM Version
10.2.4
Node Version
20.11.1
Published on
Jul 12, 2024
Cumulative downloads
Total Downloads
Last Day
0%
NaN
Compared to previous day
Last Week
0%
NaN
Compared to previous week
Last Month
0%
NaN
Compared to previous month
Last Year
0%
NaN
Compared to previous year
2
2
Improved debugging of Angular component tests with Jest!
The @angular-extension/pretty-html-log is a module that makes debugging component tests with Jest a breeze. It adds a
phlmethod which pretty prints the innerHTML of aComponentFixture, aDebugElement, aNativeElementor an HTML string.
![]()
When debugging component tests, it’s often necessary to inspect the DOM. The most common approach to do so is by using the good old console.log which has some downsides.
First of all, it’s annoying to always type
1fixture.debugElement.nativeElement.innerHTML;
Moreover, the console.log statement doesn’t print the HTML in a very readable way. Therefore we still need to copy the string in a new HTML file and format it to be able to inspect it. Not with @angular-extensions/pretty-html-log!
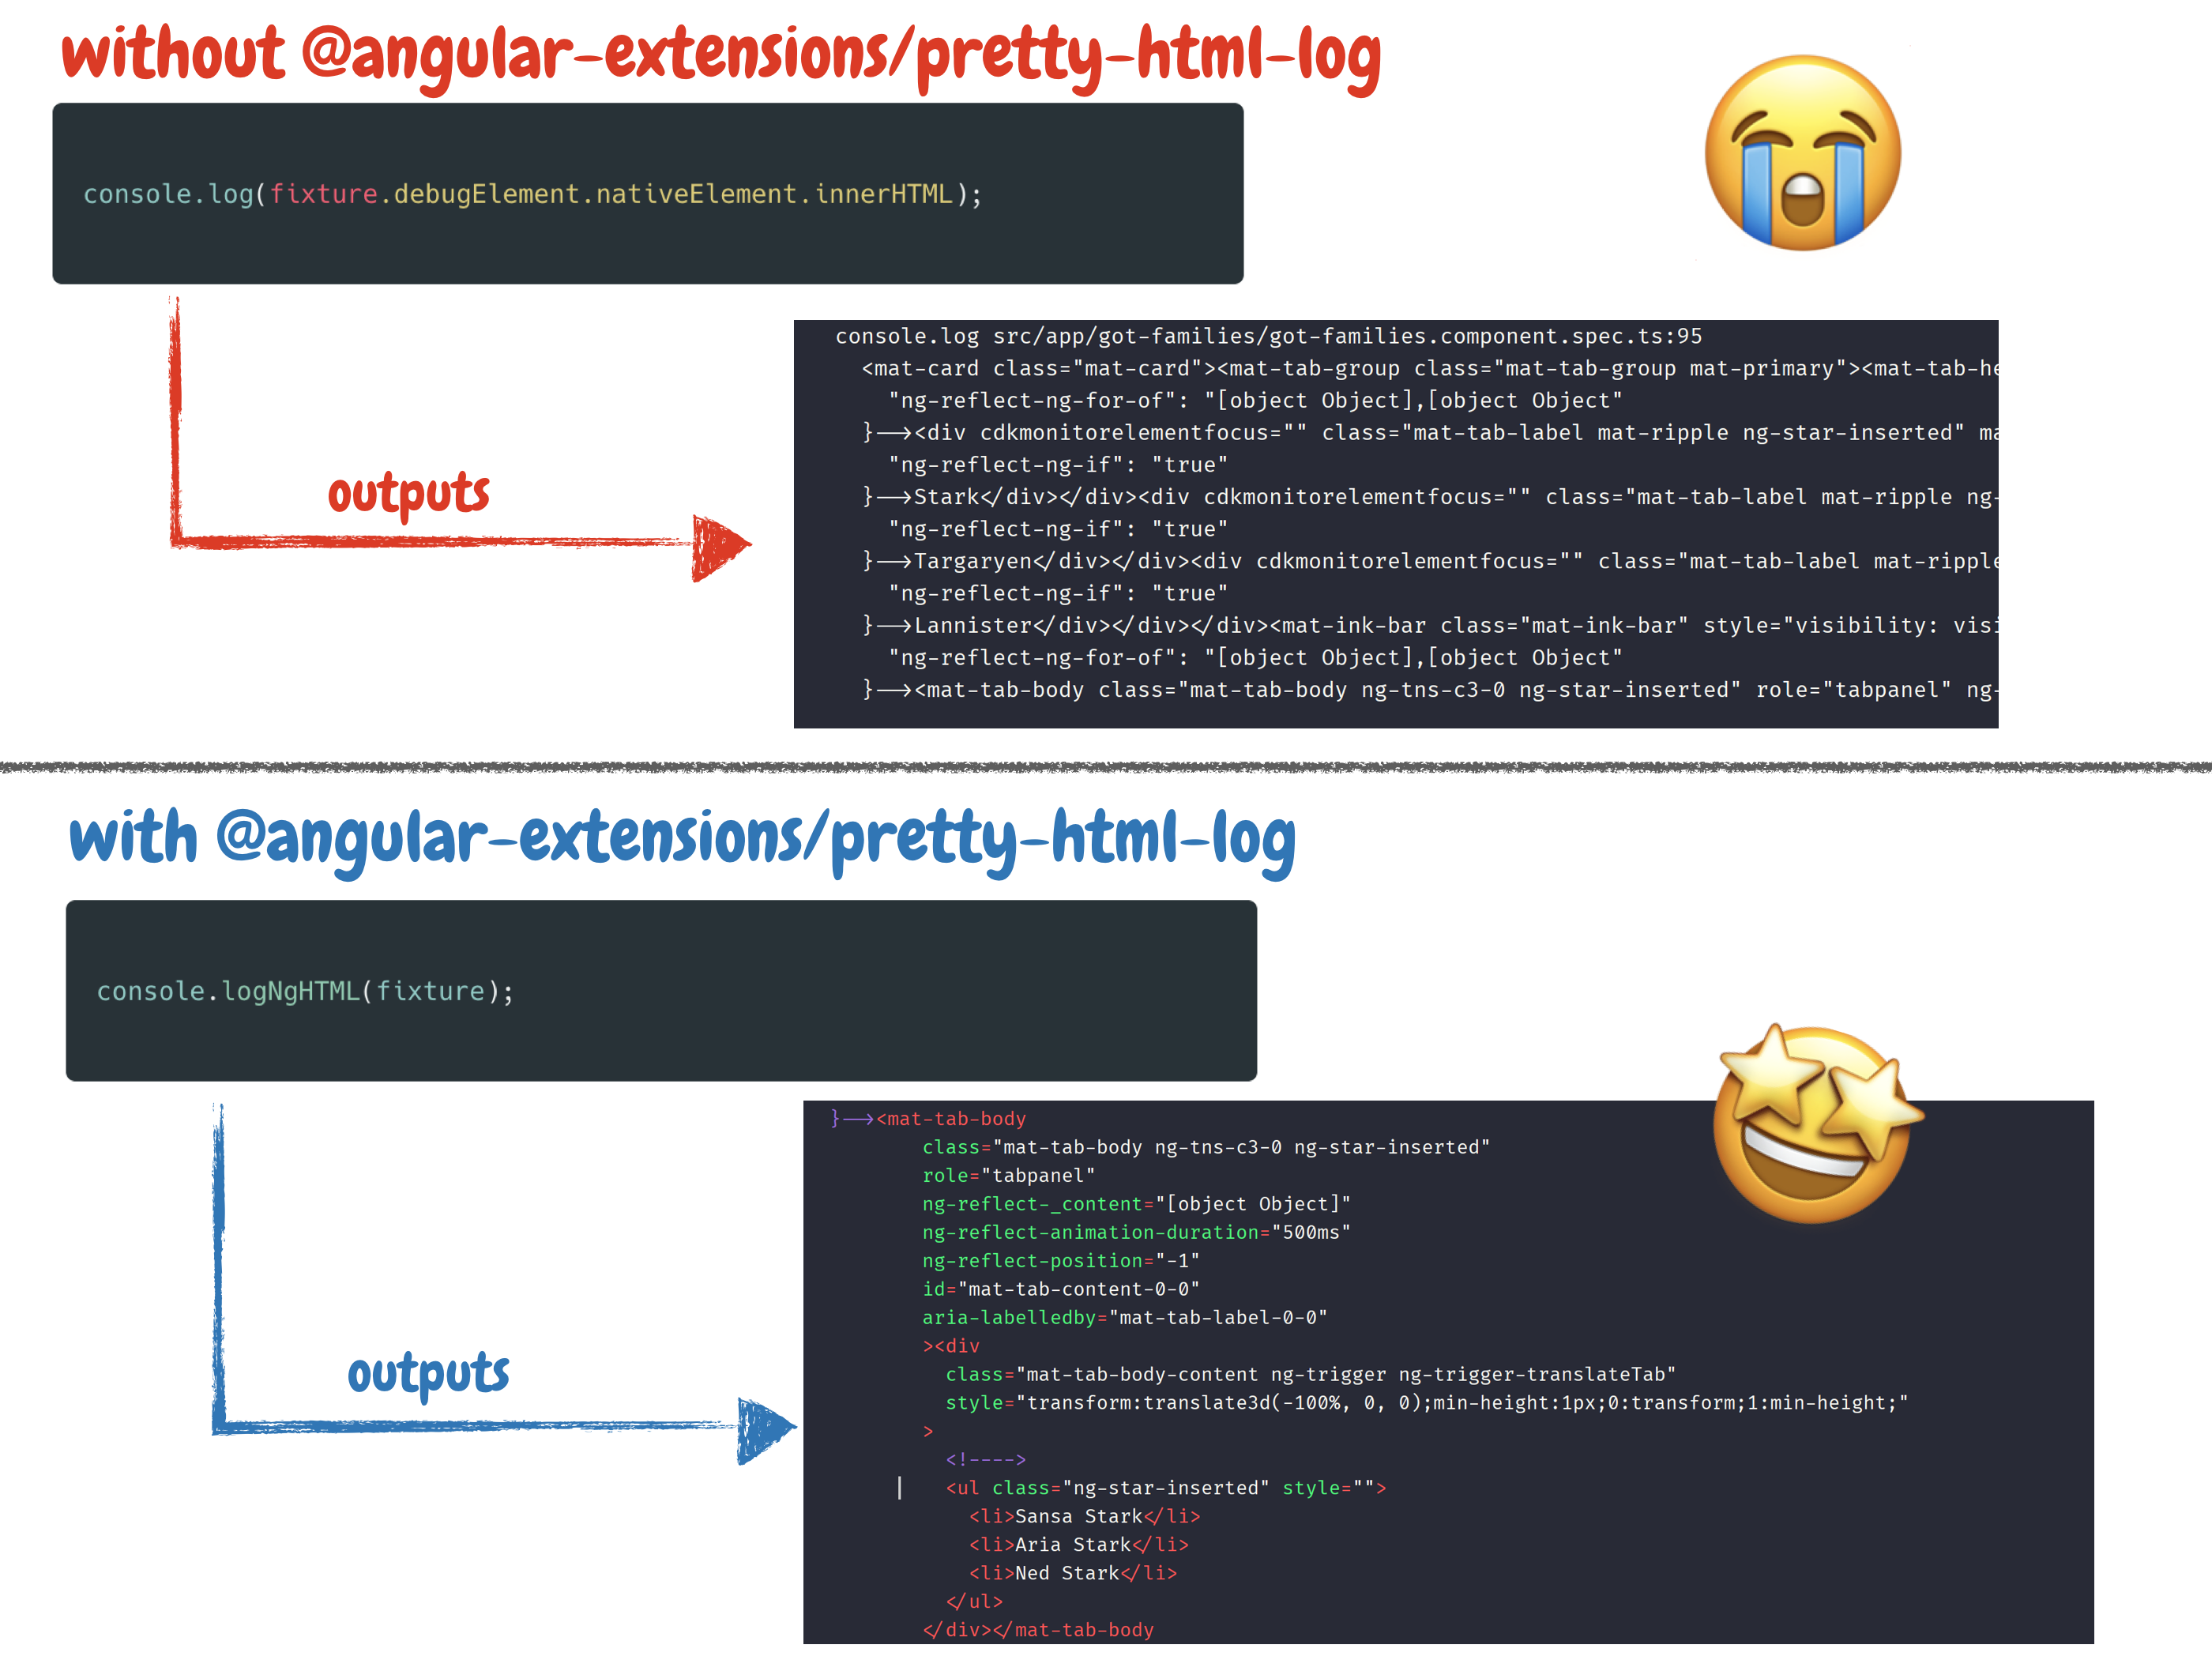
phl method that highlights and pretty prints a fixture, debugElement, nativeElement or even a plain HTML string - you don't have to worry how to get to the HTML, just pass the thing you want to print to the phl method.This module will only be used during development and can therefore be installed as a dev dependency.
npm i -D @angular-extensions/pretty-html-log
pretty-html-log can be used in two different ways. The first and most
simple way is to simply import the phl function into your test.
The @angular-extensions/pretty-html-log package provides a phl method that you can use to pretty print a fixture, debugElement, nativeElement or even a plain HTML string. Simply import it while debugging and pretty print that HTML.
1import { phl } from '@angular-extensions/pretty-html-log';
2
3describe('my test suite', () => {
4  it('should be green', () => {
5    phl(fixture); // This will pretty print the fixture
6    expect(myTable.getRows()).toBe(5);
7  });
8});
Importing the phl function is straightforward. However, since phl is often used as a temporary tool, it can be bothersome to add an import at the top of the file. This is easy to forget and requires manual cleanup afterward.
Wouldn't it be cool if we can simply use the phl function without the need of an import. Let's check out how to setup the phl function globally.
To make sure unused import statement get cleaned up we should configure our eslint to clean up unused imports. More: https://www.npmjs.com/package/eslint-plugin-unused-imports.
To make phl globally available, import and run the following method within a jest.setup.ts file.
1import { setupPhl } from '@angular-extensions/pretty-html-log';
2
3setupPhl();
The phl method has the following signature:
1<T>(
2  ngHTMLElement: NgHTMLElement<T>,
3  enableComments = false,
4  theme = THEMES.DRACULA
5)
| Property | Description |
|---|---|
| ngHTMLElement | Value to extract the html from and pretty print it to the console: ComponentFixture |
| enableComments (default: false) | When set to true we print the generated comments by Angular. For example: <!--bindings={"ng-reflect-ng-for-of":... |
| theme: (default: DRACULA) | pretty-html-log themes (DRACULA, VSCODE and MATERIAL) |
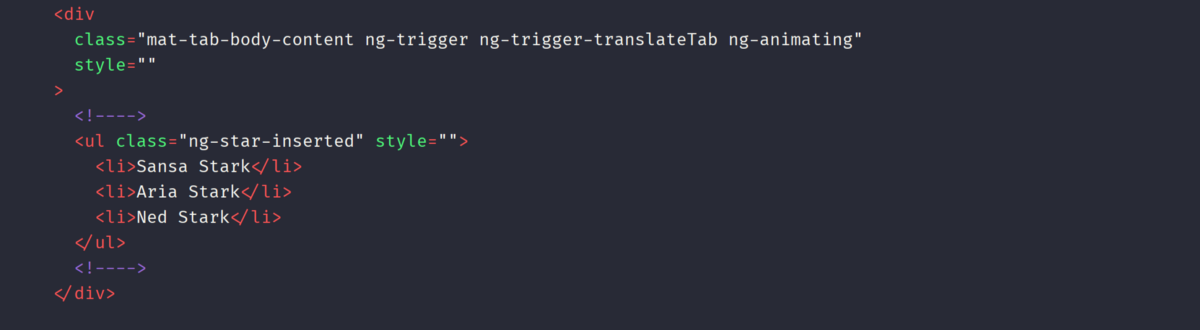
In your test you can simply write the following line.
1phl(fixture.debugElement.query(By.css('mat-tab-body')));
Which will print the following string to your console. Depending on your test configuration you
might run into an issue with the patch of the console. In such cases its best to report an issue and use the logNgHTML function directly.
1phl(fixture.debugElement.query(By.css('mat-tab-body')));
Log the content innerHTML of a fixture
1phl(fixture);
of a debugElement (or multiple debugElements)
1phl(fixture.debugElement);
of a nativeElement (or multiple nativeElements)
1phl(fixture.debugElement.nativeElement);
or even a simple HTML string
1phl('<h1>Foo</h1>');
Angular adds some comments to our HTML file. Usually, when debugging our tests, we don't need them. Therefore they
are not printed by default. However, there are cases where you want to print those comments. To do so, you
can pass true as an additional flag tot he logNgHTML method.
1phl(fixture, true);
@angular-extensions/pretty-html-log allows you to print the html logs in different themes.
Currently, we support (DRACULA, VSCODE and MATERIAL). The themes can be importet from pretty-html-log, the base library @angular-extensions/pretty-html-log depends on.
1import { THEMES } from 'pretty-html-log';
2
3console.logNgHTML(fixture, false, THEMES.VSCODE);
Improved debugging of Angular component tests in Jest is a write up on AngularInDepth that shows how @angular-extensions/pretty-html-log is used and set up in a project.


No vulnerabilities found.
Reason
no binaries found in the repo
Reason
license file detected
Details
Reason
0 commit(s) and 0 issue activity found in the last 90 days -- score normalized to 0
Reason
Found 0/14 approved changesets -- score normalized to 0
Reason
no effort to earn an OpenSSF best practices badge detected
Reason
security policy file not detected
Details
Reason
project is not fuzzed
Details
Reason
branch protection not enabled on development/release branches
Details
Reason
SAST tool is not run on all commits -- score normalized to 0
Details
Reason
100 existing vulnerabilities detected
Details
Score
Last Scanned on 2025-07-07
The Open Source Security Foundation is a cross-industry collaboration to improve the security of open source software (OSS). The Scorecard provides security health metrics for open source projects.
Learn More