Gathering detailed insights and metrics for chartjs-chart-venn
Gathering detailed insights and metrics for chartjs-chart-venn
Gathering detailed insights and metrics for chartjs-chart-venn
Gathering detailed insights and metrics for chartjs-chart-venn
npm install chartjs-chart-venn81.1
Supply Chain
99.6
Quality
88.7
Maintenance
100
Vulnerability
100
License
Module System
Min. Node Version
Typescript Support
Node Version
NPM Version
67 Stars
279 Commits
13 Forks
5 Watching
3 Branches
1 Contributors
Updated on 17 Nov 2024
TypeScript (85.87%)
JavaScript (14.13%)
Cumulative downloads
Total Downloads
Last day
-9.6%
319
Compared to previous day
Last week
-3.7%
1,972
Compared to previous week
Last month
16.2%
8,274
Compared to previous month
Last year
90.4%
56,833
Compared to previous year
1
1
36
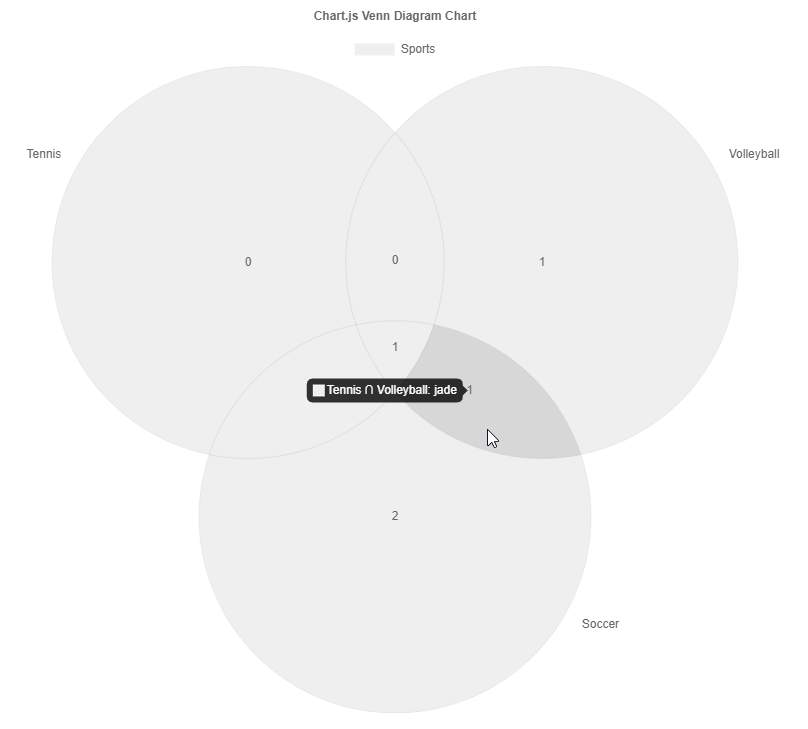
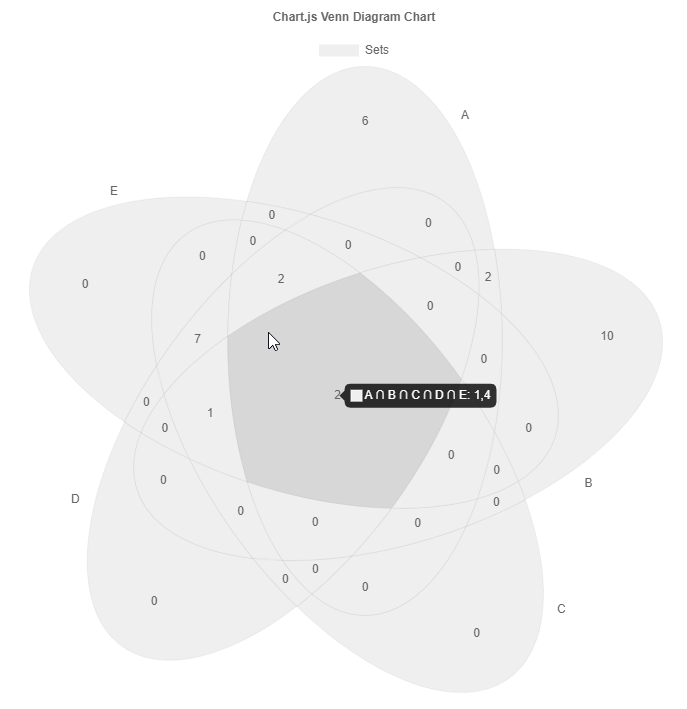
Chart.js module for charting venn diagrams with up to five sets. Adding new chart type: venn and euler.


Check out also my other chart.js plugins:
1npm install --save chart.js chartjs-chart-venn
see Examples
1const config = {
2  type: 'venn',
3  data: ChartVenn.extractSets(
4    [
5      { label: 'Soccer', values: ['alex', 'casey', 'drew', 'hunter'] },
6      { label: 'Tennis', values: ['casey', 'drew', 'jade'] },
7      { label: 'Volleyball', values: ['drew', 'glen', 'jade'] },
8    ],
9    {
10      label: 'Sports',
11    }
12  ),
13  options: {},
14};
Alternative data structure
1const config = {
2  type: 'venn',
3  data: {
4    labels: [
5      'Soccer',
6      'Tennis',
7      'Volleyball',
8      'Soccer ∩ Tennis',
9      'Soccer ∩ Volleyball',
10      'Tennis ∩ Volleyball',
11      'Soccer ∩ Tennis ∩ Volleyball',
12    ],
13    datasets: [
14      {
15        label: 'Sports',
16        data: [
17          { sets: ['Soccer'], value: 2 },
18          { sets: ['Tennis'], value: 0 },
19          { sets: ['Volleyball'], value: 1 },
20          { sets: ['Soccer', 'Tennis'], value: 1 },
21          { sets: ['Soccer', 'Volleyball'], value: 0 },
22          { sets: ['Tennis', 'Volleyball'], value: 1 },
23          { sets: ['Soccer', 'Tennis', 'Volleyball'], value: 1 },
24        ],
25      },
26    ],
27  },
28  options: {},
29};
ArcSlice elements have the basic backgroundColor, borderColor, and borderWidth properties similar to a regular rectangle.
The x scale ticks options are used to configure the set value labels within the intersections.
The y scale ticks options are used to configure the set label labels next ot the set circles.
Changing the tick display options (e.g. scales.x.ticks.display = false) will disable the set value labels.
Similarly, its font spec and color are used to the styling of the labels.
Euler diagrams are relaxed proportional venn diagrams such that the area of the circles and overlap try to fit the overlapping value. It is a relaxed in a way that is just approximates the proportions using a numerical optimization process. Moreover, only one and two set overlaps are used for the computation. The library uses venn.js in the background.
1const config = {
2  type: 'euler',
3  data: ChartVenn.extractSets(
4    [
5      { label: 'A', values: [1, 2, 3, 4, 11, 12, 13, 14, 15, 16, 17, 18] },
6      { label: 'B', values: [1, 2, 3, 4, 5, 6, 7, 8, 9, 10, 19, 20, 21, 22, 23] },
7      { label: 'C', values: [1, 11, 12, 4, 5, 24, 25, 26, 27, 28, 29, 30] },
8    ],
9    {
10      label: 'Sets',
11    }
12  ),
13  options: {},
14};
see Venn Diagram
The ESM build of the library supports tree shaking thus having no side effects. As a consequence the chart.js library won't be automatically manipulated nor new controllers automatically registered. One has to manually import and register them.
Variant A:
1import { Chart, LinearScale } from 'chart.js';
2import { VennDiagramController, ArcSlice } from 'chartjs-chart-venn';
3
4Chart.register(VennDiagramController, ArcSlice, LinearScale);
5...
6
7new Chart(ctx, {
8  type: VennDiagramController.id,
9  data: [...],
10});
Variant B:
1import { VennDiagramChart } from 'chartjs-chart-venn';
2
3new VennDiagramChart(ctx, {
4  data: [...],
5});
1npm i -g yarn
2yarn install
3yarn sdks vscode
1yarn compile
2yarn test
3yarn lint
4yarn fix
5yarn build
6yarn docs

No vulnerabilities found.
Reason
no dangerous workflow patterns detected
Reason
30 commit(s) and 0 issue activity found in the last 90 days -- score normalized to 10
Reason
no binaries found in the repo
Reason
license file detected
Details
Reason
1 existing vulnerabilities detected
Details
Reason
Found 0/1 approved changesets -- score normalized to 0
Reason
no effort to earn an OpenSSF best practices badge detected
Reason
detected GitHub workflow tokens with excessive permissions
Details
Reason
project is not fuzzed
Details
Reason
dependency not pinned by hash detected -- score normalized to 0
Details
Reason
Project has not signed or included provenance with any releases.
Details
Reason
security policy file not detected
Details
Reason
SAST tool is not run on all commits -- score normalized to 0
Details
Reason
branch protection not enabled on development/release branches
Details
Score
Last Scanned on 2024-11-18
The Open Source Security Foundation is a cross-industry collaboration to improve the security of open source software (OSS). The Scorecard provides security health metrics for open source projects.
Learn More