Gathering detailed insights and metrics for protractor-beautiful-reporter
Gathering detailed insights and metrics for protractor-beautiful-reporter
Gathering detailed insights and metrics for protractor-beautiful-reporter
Gathering detailed insights and metrics for protractor-beautiful-reporter
@types/protractor-beautiful-reporter
TypeScript definitions for protractor-beautiful-reporter
jasmine-spec-reporter
Spec reporter for jasmine behavior-driven development framework
protractor-jasmine2-screenshot-reporter
Use the screenshot reporter to capture screenshots after each executed Protractor test case.
protractor-html-reporter-2
To generate HTML report for Protractor test execution with pie charts
npm install protractor-beautiful-reporter90.1
Supply Chain
99
Quality
75.3
Maintenance
100
Vulnerability
100
License
Module System
Min. Node Version
Typescript Support
Node Version
NPM Version
170 Stars
376 Commits
40 Forks
13 Watching
6 Branches
2 Contributors
Updated on 04 Nov 2024
Minified
Minified + Gzipped
JavaScript (97.23%)
HTML (2.49%)
CSS (0.28%)
Cumulative downloads
Total Downloads
Last day
-3.8%
3,651
Compared to previous day
Last week
3.4%
22,408
Compared to previous week
Last month
1%
95,248
Compared to previous month
Last year
-14.5%
1,329,181
Compared to previous year
4
25
Hello, I no longer have time to maintain this repository, but i see that there are people here that would like to use this tool. Feel free to reach out to me if you want to become new maintainer - email on the bottom of this page :)
Error: TypeError: Cannot set property 'searchSettings' of undefined use at least version 1.2.7, where this bug has been fixedNeed some feature? Let me know or code it and propose Pull Request :) But you might also look in our WIKI/FAQ where we present some solutions how you can enhance the reporter by yourself.
Does not work with protractor-retry or protractor-flake. The collection of results currently assumes only one continuous run.
This is built on top of protractor-angular-screenshot-reporter, which is built on top of protractor-html-screenshot-reporter, which is built on top of protractor-screenshot-reporter.
protractor-beautiful-reporter still generates a HTML report, but it is Angular-based and improves on the original formatting.
The protractor-beautiful-reporter module is available via npm:
1$ npm install protractor-beautiful-reporter --save-dev
In your Protractor configuration file, register protractor-beautiful-reporter in Jasmine.
1No longer supported
Jasmine 2.x introduced changes to reporting that are not backwards compatible. To use protractor-beautiful-reporter with Jasmine 2, please make sure to use the getJasmine2Reporter() compatibility method introduced in protractor-beautiful-reporter@0.1.0.
1var HtmlReporter = require('protractor-beautiful-reporter');
2
3exports.config = {
4   // your config here ...
5
6   onPrepare: function() {
7      // Add a screenshot reporter and store screenshots to `/tmp/screenshots`:
8      jasmine.getEnv().addReporter(new HtmlReporter({
9         baseDirectory: 'tmp/screenshots'
10      }).getJasmine2Reporter());
11   }
12}
You have to pass a directory path as parameter when creating a new instance of the screenshot reporter:
1var reporter = new HtmlReporter({
2   baseDirectory: 'tmp/screenshots'
3});
If the given directory does not exists, it is created automatically as soon as a screenshot needs to be stored.
The function passed as second argument to the constructor is used to build up paths for screenshot files:
1var path = require('path');
2
3new HtmlReporter({
4   baseDirectory: 'tmp/screenshots'
5   , pathBuilder: function pathBuilder(spec, descriptions, results, capabilities) {
6      // Return '<browser>/<specname>' as path for screenshots:
7      // Example: 'firefox/list-should work'.
8      return path.join(capabilities.caps_.browser, descriptions.join('-'));
9   }
10});
If you omit the path builder, a GUID is used by default instead.
Caution: The format/structure of these parameters (spec, descriptions, results, capabilities) differs between Jasmine 2.x and Jasmine 1.x.
(removed because was only used in jasmine 1.x)
You can modify the contents of the JSON meta data file by passing a function jasmine2MetaDataBuilder as part of the options parameter.
Note: We have to store and call the original jasmine2MetaDataBuilder also, else we break the "whole" reporter.
The example is a workaround for the jasmine quirk https://github.com/angular/jasminewd/issues/32 which reports pending() as failed.
1var originalJasmine2MetaDataBuilder = new HtmlReporter({'baseDirectory': './'})["jasmine2MetaDataBuilder"];
2jasmine.getEnv().addReporter(new HtmlReporter({
3    baseDirectory: 'tmp/screenshots'
4    jasmine2MetaDataBuilder: function (spec, descriptions, results, capabilities) {
5        //filter for pendings with pending() function and "unfail" them
6        if (results && results.failedExpectations && results.failedExpectations.length>0 && "Failed: => marked Pending" === results.failedExpectations[0].message) {
7            results.pendingReason = "Marked Pending with pending()";
8            results.status = "pending";
9            results.failedExpectations = [];
10        }
11        //call the original method after my own mods
12        return originalJasmine2MetaDataBuilder(spec, descriptions, results, capabilities);
13    },
14    preserveDirectory: false
15}).getJasmine2Reporter());
You can store all images in subfolder by using screenshotsSubfolder option:
1new HtmlReporter({
2   baseDirectory: 'tmp/screenshots'
3   , screenshotsSubfolder: 'images'
4});
If you omit this, all images will be stored in main folder.
You can store all JSONs in subfolder by using jsonsSubfolder option:
1new HtmlReporter({
2   baseDirectory: 'tmp/screenshots'
3   , jsonsSubfolder: 'jsons'
4});
If you omit this, all images will be stored in main folder.
You can change default sortFunction option:
1new HtmlReporter({
2   baseDirectory: 'tmp/screenshots'
3   , sortFunction: function sortFunction(a, b) {
4         if (a.cachedBase === undefined) {
5             var aTemp = a.description.split('|').reverse();
6             a.cachedBase = aTemp.slice(0).slice(0,-1);
7             a.cachedName = aTemp.slice(0).join('');
8         };
9         if (b.cachedBase === undefined) {
10             var bTemp = b.description.split('|').reverse();
11             b.cachedBase = bTemp.slice(0).slice(0,-1);
12             b.cachedName = bTemp.slice(0).join('');
13         };
14
15         var firstBase = a.cachedBase;
16         var secondBase = b.cachedBase;
17
18         for (var i = 0; i < firstBase.length || i < secondBase.length; i++) {
19
20             if (firstBase[i] === undefined) { return -1; }
21             if (secondBase[i] === undefined) { return 1; }
22             if (firstBase[i].localeCompare(secondBase[i]) === 0) { continue; }
23             return firstBase[i].localeCompare(secondBase[i]);
24         }
25
26         var firstTimestamp = a.timestamp;
27         var secondTimestamp = b.timestamp;
28
29         if(firstTimestamp < secondTimestamp) return -1;
30         else return 1;
31     }
32});
If you omit this, all specs will be sorted by timestamp (please be aware that sharded runs look ugly when sorted by default sort).
Alternatively if the result is not good enough in sharded test you can try and sort by instanceId (for now it's process.pid) first:
1function sortFunction(a, b) {
2    if (a.instanceId < b.instanceId) return -1;
3    else if (a.instanceId > b.instanceId) return 1;
4
5    if (a.timestamp < b.timestamp) return -1;
6    else if (a.timestamp > b.timestamp) return 1;
7
8    return 0;
9}
You can set excludeSkippedSpecs to true to exclude reporting skipped test cases entirely.
1new HtmlReporter({
2  baseDirectory: `tmp/screenshots`
3  , excludeSkippedSpecs: true
4});
Default is false.
You can define if you want report screenshots from skipped test cases using the takeScreenShotsForSkippedSpecs option:
1new HtmlReporter({
2   baseDirectory: 'tmp/screenshots'
3   , takeScreenShotsForSkippedSpecs: true
4});
Default is false.
Also you can define if you want capture screenshots only from failed test cases using the takeScreenShotsOnlyForFailedSpecs: option:
1new HtmlReporter({
2   baseDirectory: 'tmp/screenshots'
3   , takeScreenShotsOnlyForFailedSpecs: true
4});
If you set the value to true, the reporter for the passed test will still be generated, but, there will be no screenshot.
Default is false.
If you want no screenshots at all, set the disableScreenshots option to true.
1new HtmlReporter({
2   baseDirectory: 'tmp/reports'
3   , disableScreenshots: true
4});
Default is false.
Also you can define a document title for the html report generated using the docTitle: option:
1new HtmlReporter({
2   baseDirectory: 'tmp/screenshots'
3   , docTitle: 'my reporter'
4});
Default is Test results.
Also you can change document name for the html report generated using the docName: option:
1new HtmlReporter({
2   baseDirectory: 'tmp/screenshots'
3   , docName: 'index.html'
4});
Default is report.html.
You can change stylesheet used for the html report generated using the cssOverrideFile: option:
1new HtmlReporter({
2   baseDirectory: 'tmp/screenshots'
3   , cssOverrideFile: 'css/style.css'
4});
If you want to add small customizations without replaceing the whole css file:
1new HtmlReporter({
2   baseDirectory: 'tmp/screenshots'
3   customCssInline:`
4.mediumColumn:not([ng-class]) {
5   white-space: pre-wrap;
6}
7`
8});
This example will enable line-wrapping if the tests spec contains newline characters
You can preserve (or clear) the base directory using preserveDirectory: option:
1new HtmlReporter({
2   baseDirectory: 'tmp/screenshots'
3   , preserveDirectory: false
4});
Default is true.
You can gather browser logs using gatherBrowserLogs: option:
1new HtmlReporter({
2   baseDirectory: 'tmp/screenshots'
3   , gatherBrowserLogs: false
4});
Default is true.
If you do not want all buttons in the search filter pressed by default you can modify the default state via searchSettings: option:
For example: We filter out all passed tests when report page is opened
1new HtmlReporter({
2   baseDirectory: 'tmp/screenshots'
3   , clientDefaults:{
4       searchSettings:{
5           allselected: false,
6           passed: false,
7           failed: true,
8           pending: true,
9           withLog: true
10       }
11   }
12});
Default is every option is set to true
If you do not want to show all columns by default you can modify the default choice via columnSettings: option:
For example: We only want the time column by default
1new HtmlReporter({
2   baseDirectory: 'tmp/screenshots'
3   , clientDefaults:{
4      columnSettings:{
5          displayTime:true,
6          displayBrowser:false,
7          displaySessionId:false,
8          displayOS:false,
9          inlineScreenshots:false
10      }
11   }
12});
Default is every option except inlineScreenshots is set to true
Additionally you can customize the time values for coloring the time column. For example if you want to mark the time orange when the test took longer than 1 second and red when the test took longer than 1.5 seconds add the following to columnSettings (values are in milliseconds scale):
1   new HtmlReporter({
2      baseDirectory: 'tmp/screenshots'
3      , clientDefaults:{
4         columnSettings:{
5            warningTime: 1000,
6            dangerTime: 1500
7         }
8      }
9   });
If you want to show the total duration in the header or footer area...
1  new HtmlReporter({
2     baseDirectory: 'reports'
3     , clientDefaults:{
4         showTotalDurationIn: "header",
5         totalDurationFormat: "hms"
6     }
7  });
For all possible values for showTotalDurationIn and totalDurationFormat refer to the wiki entry Options for showing total duration of e2e test
By default the raw data of all tests results from the e2e session are embedded in the main javascript file (array results in app.js).
If you add useAjax:true to clientDefaults the data is not embedded in the app.js but is loaded from the file combined.json which contains all the raw test results.
Currently the reason for this feature is a better testability in unit tests. But you could benefit from ajax loading, if you want to polish/postprocess tests results (e.g. filter duplicated test results). This would not be possible if the data is embedded in the app.js file.
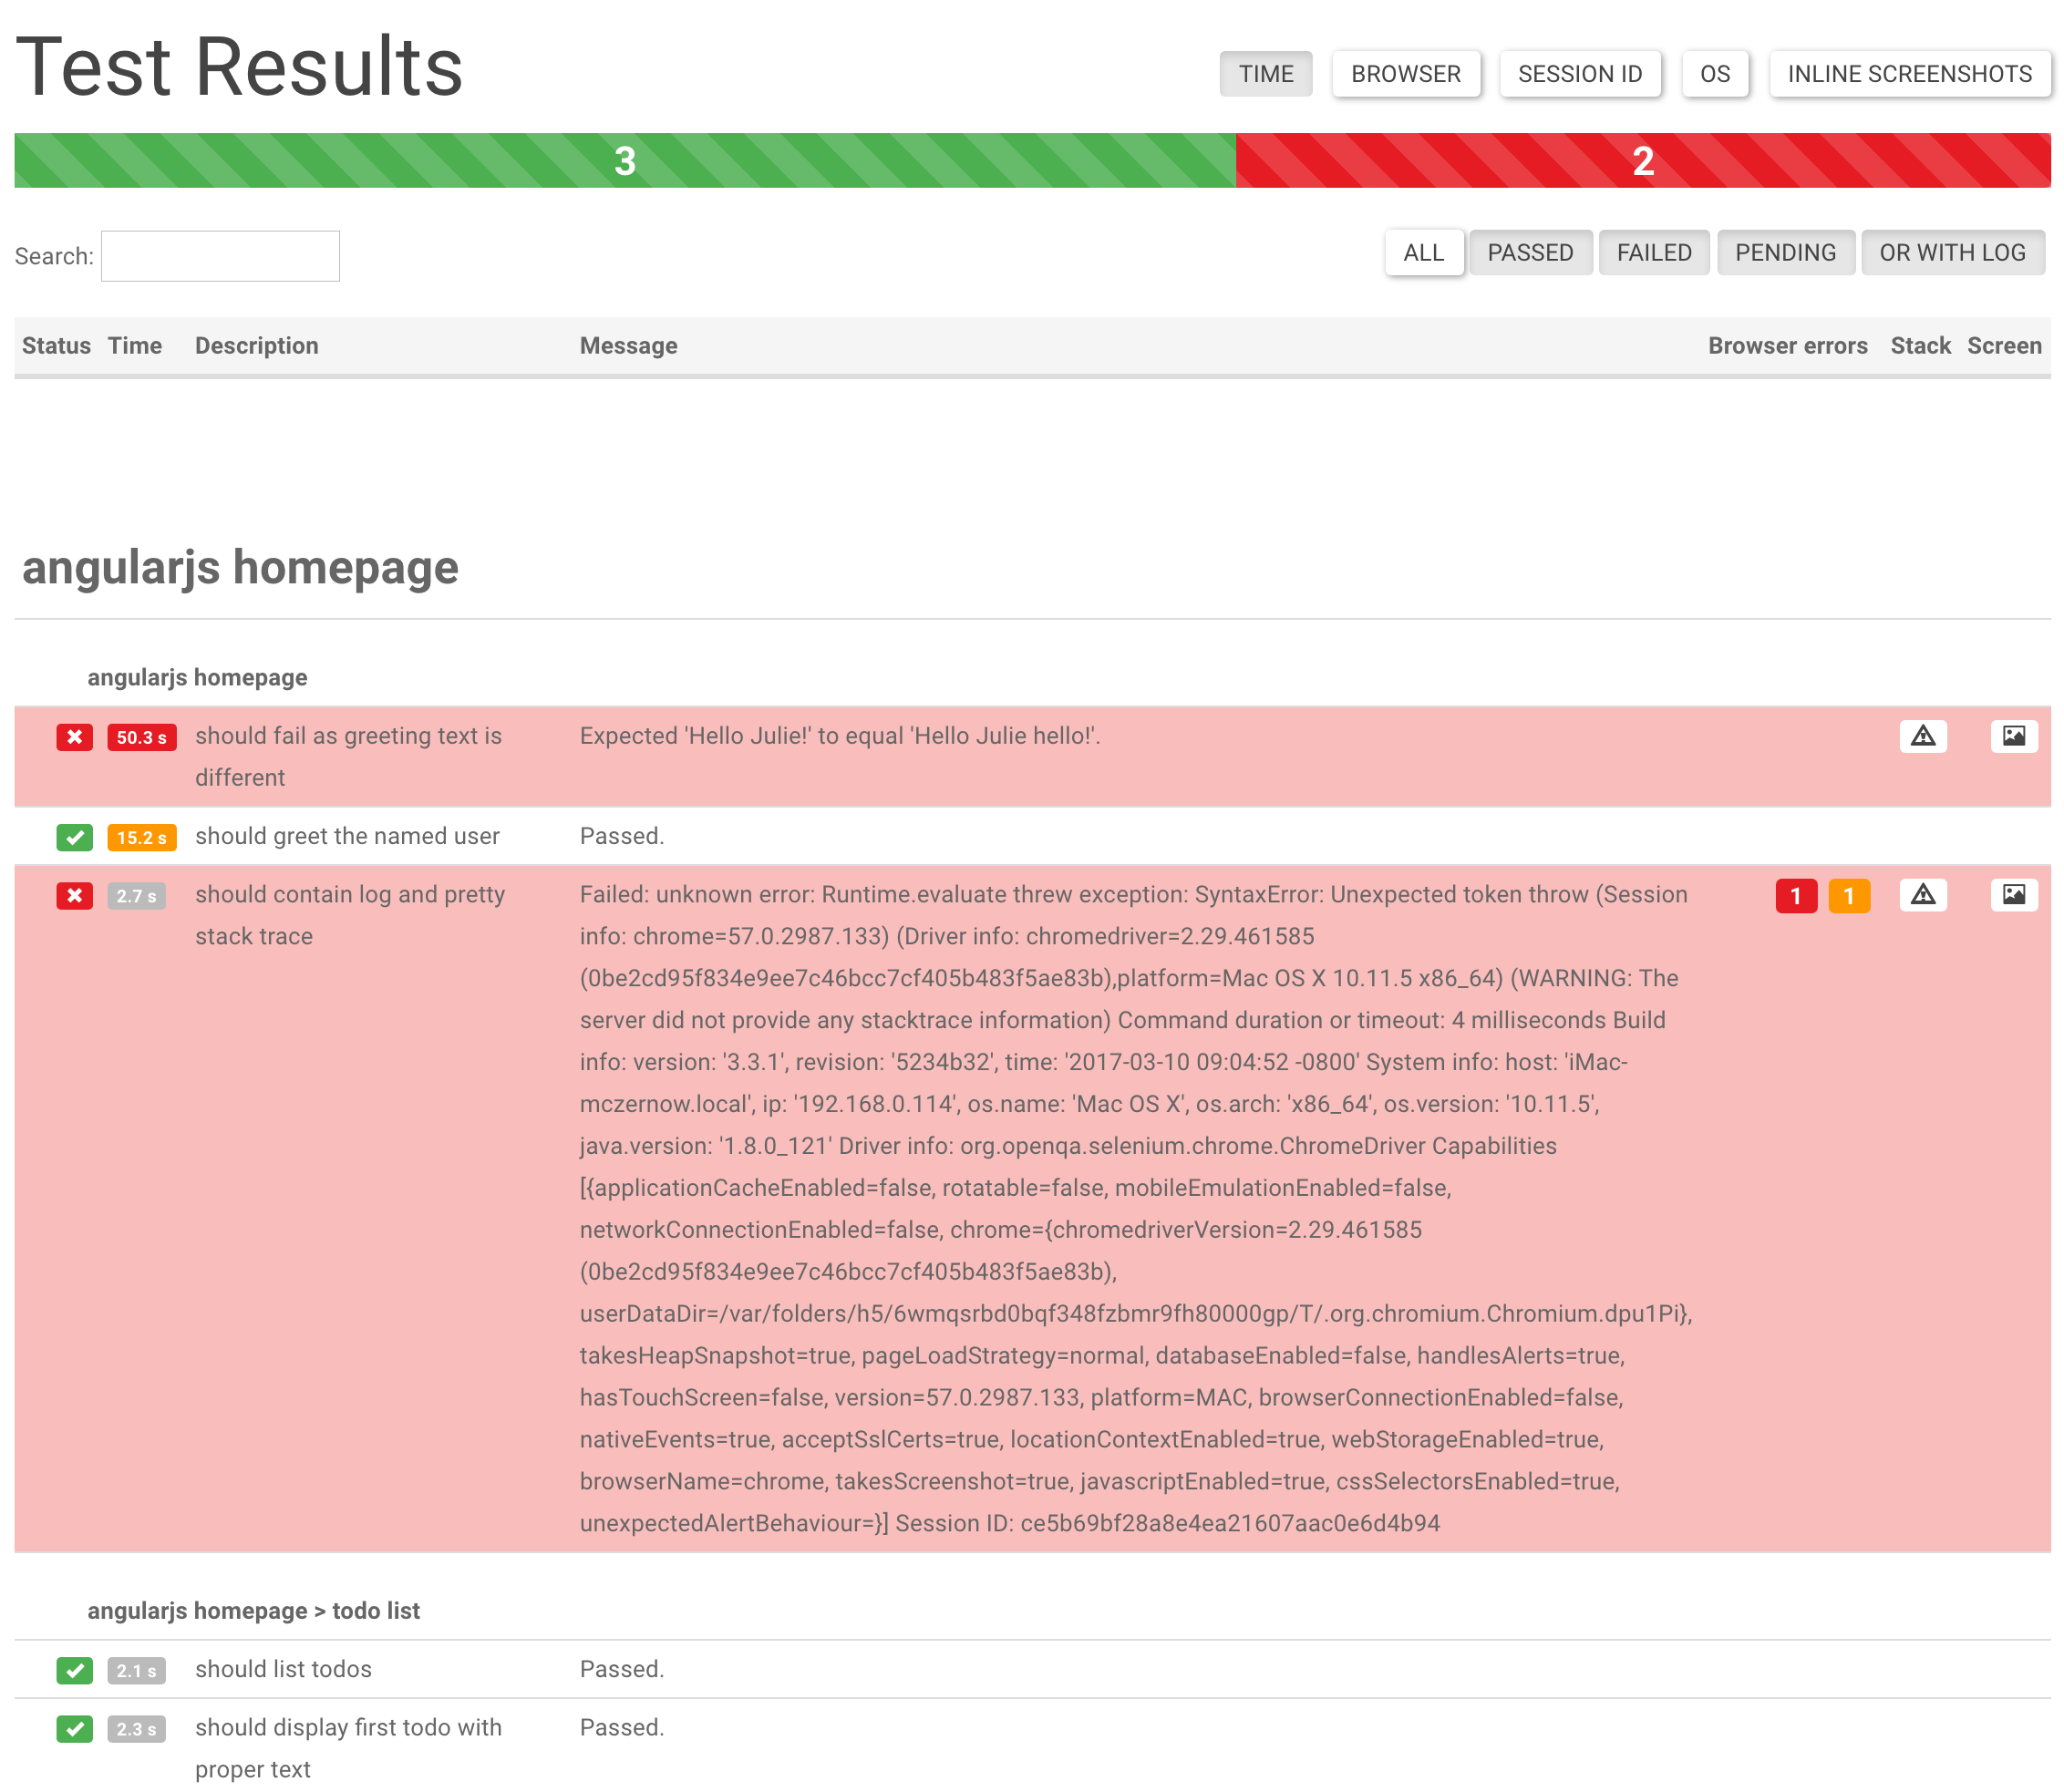
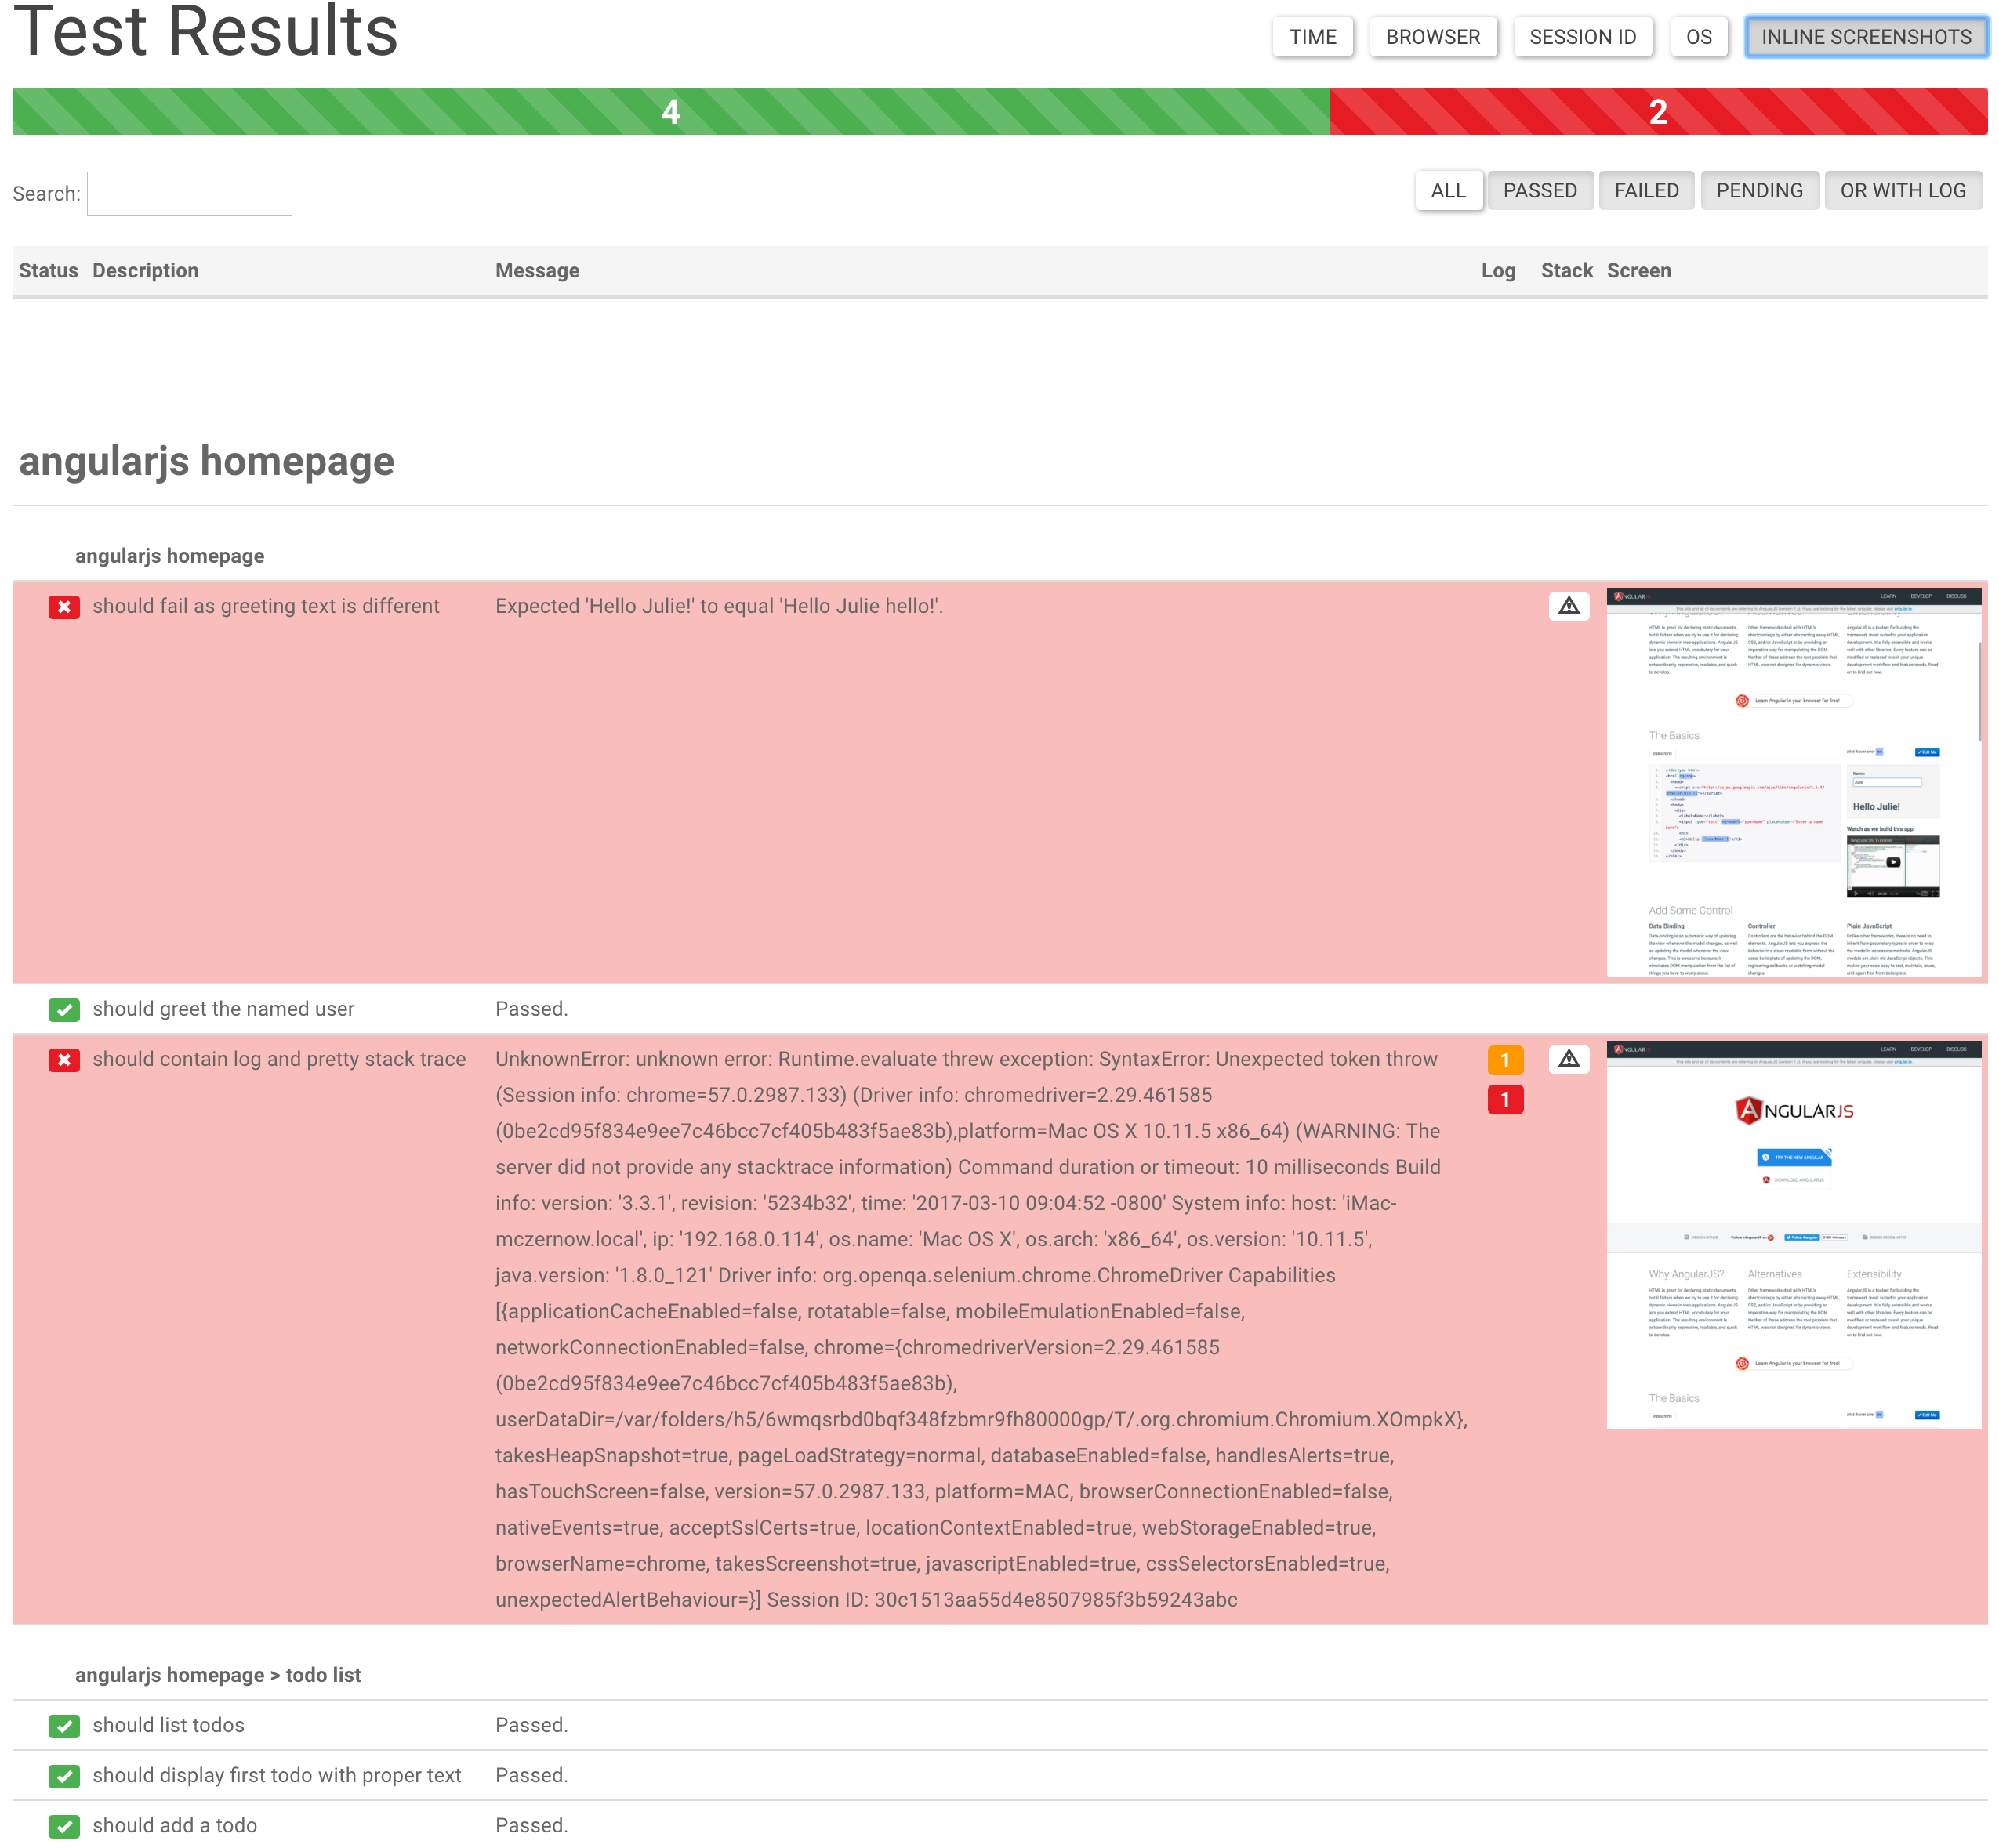
Upon running Protractor tests with the above config, the screenshot reporter will generate JSON and PNG files for each test.
In addition, a small HTML/Angular app is copied to the output directory, which cleanly lists the test results, any errors (with stacktraces), and screenshots.

Click More Details to see more information about the test runs.
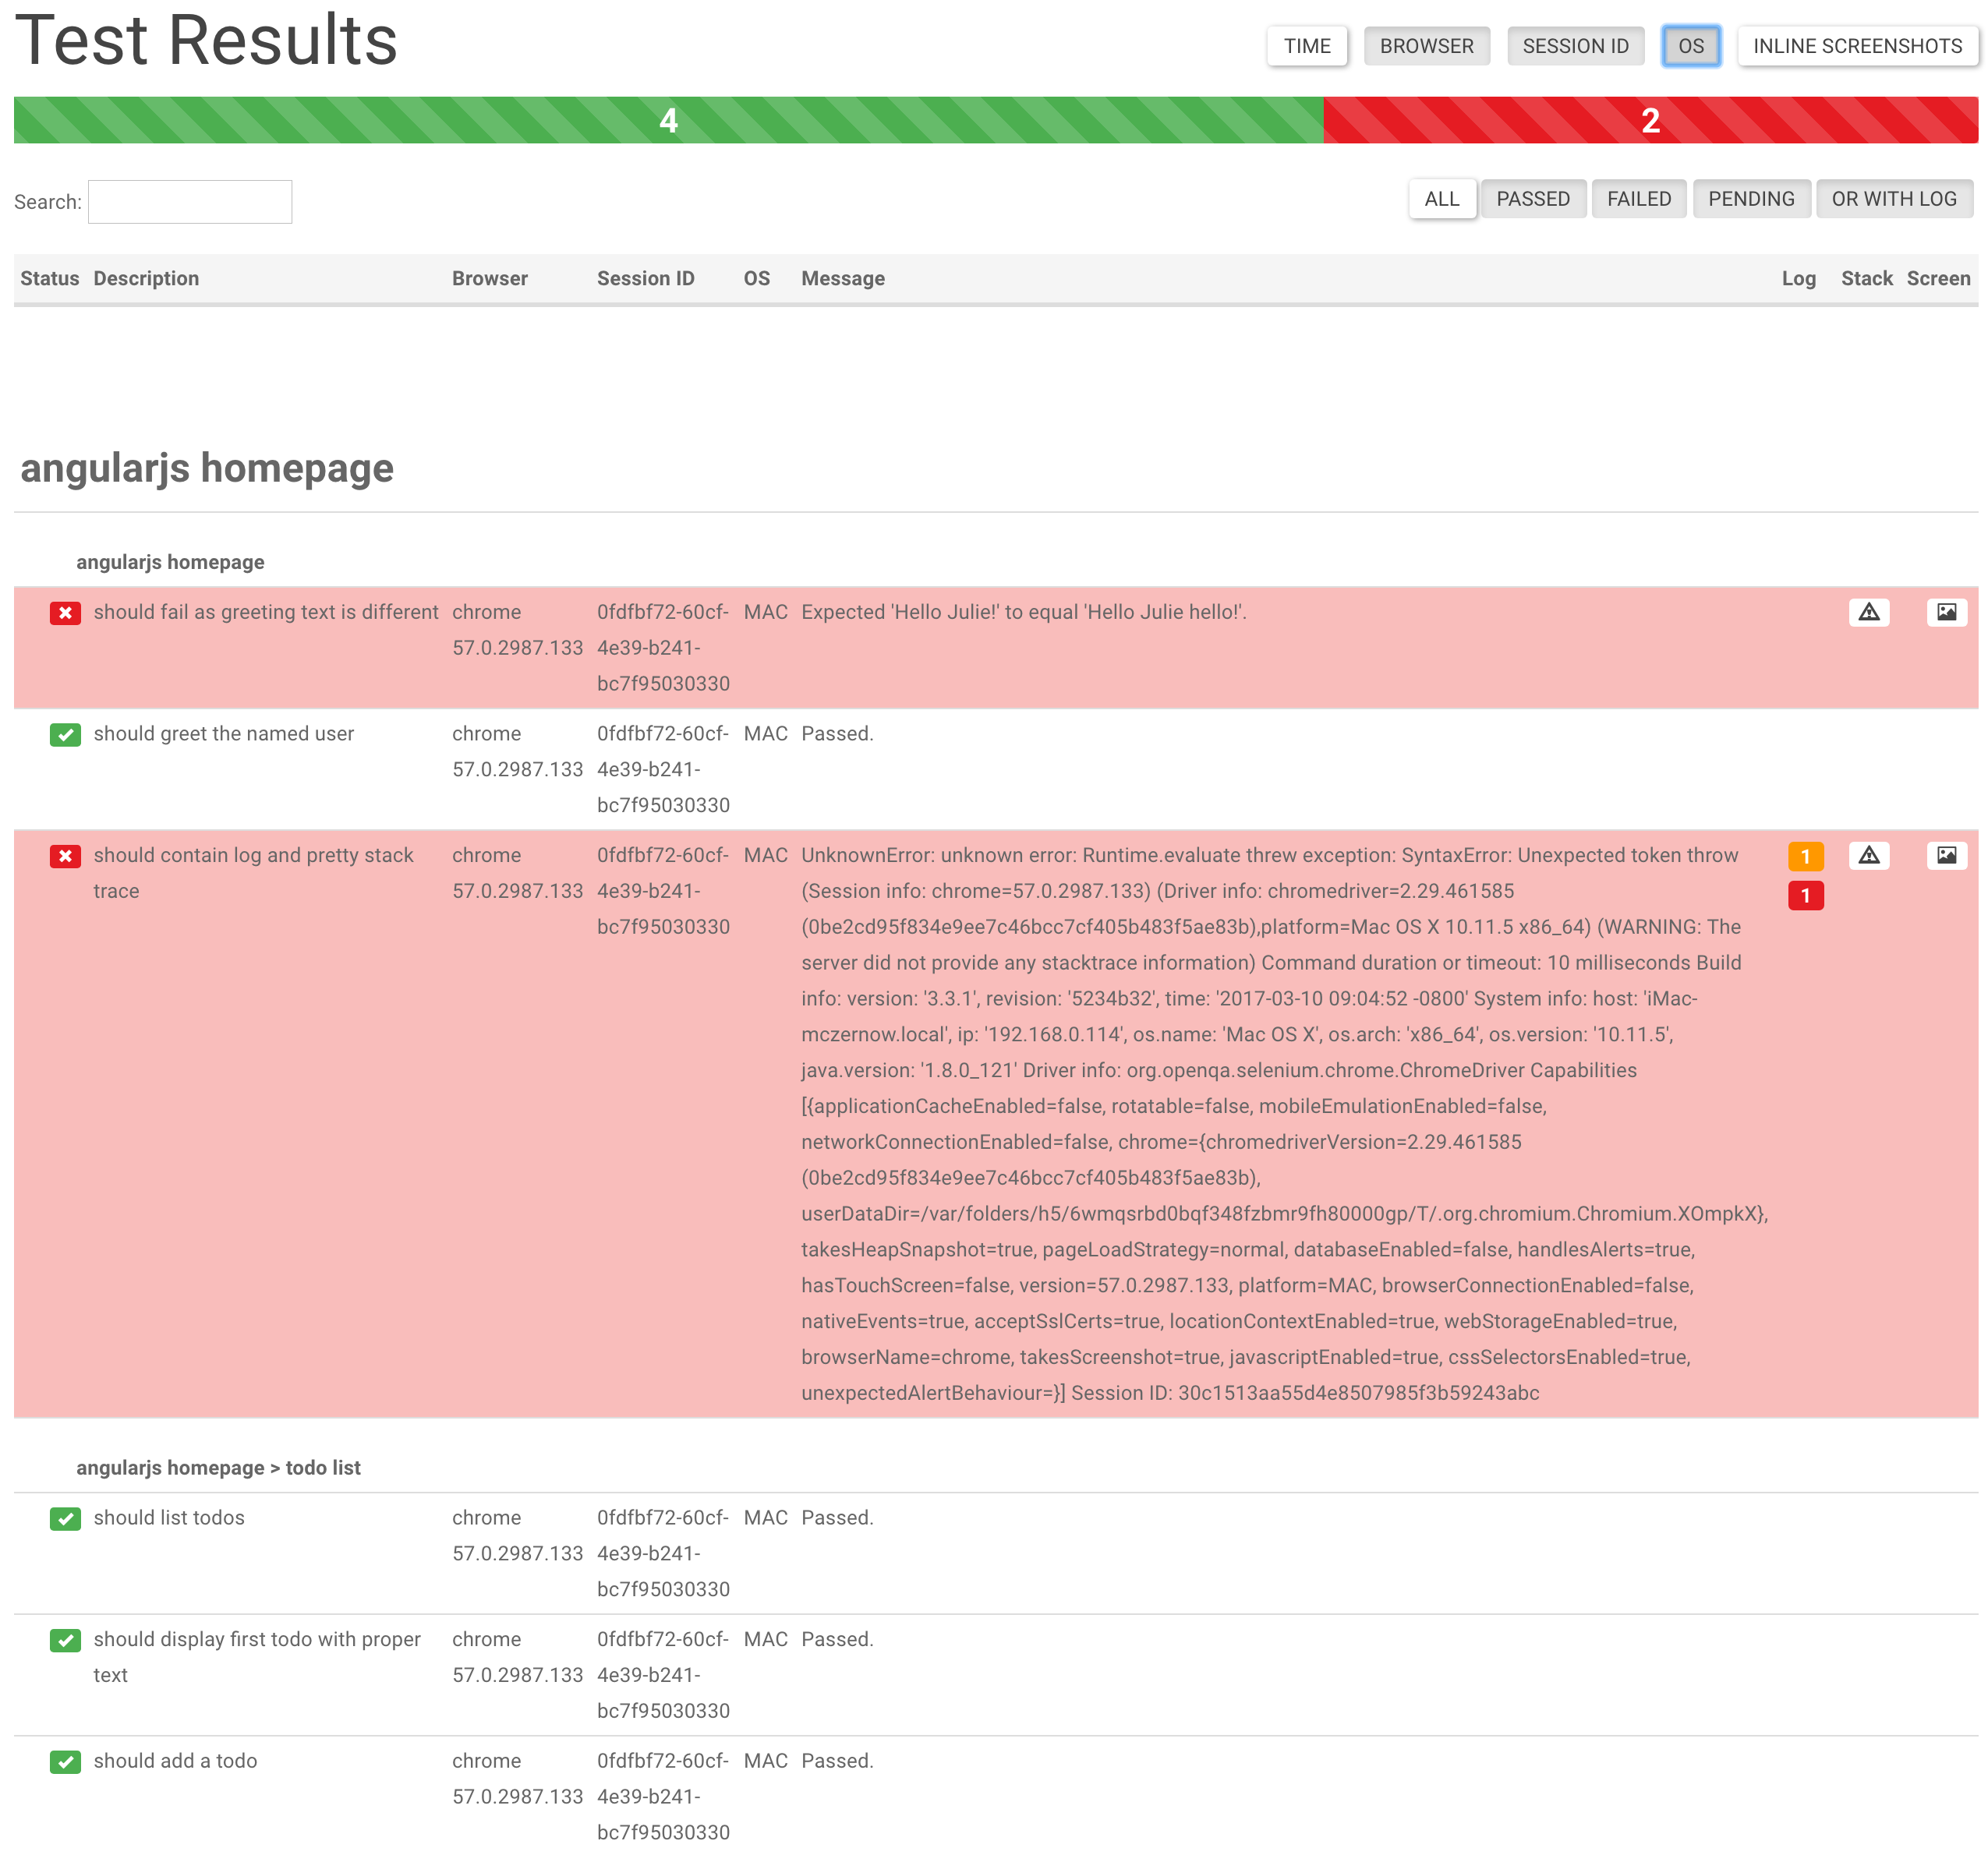
Use Search Input Field to narrow down test list.
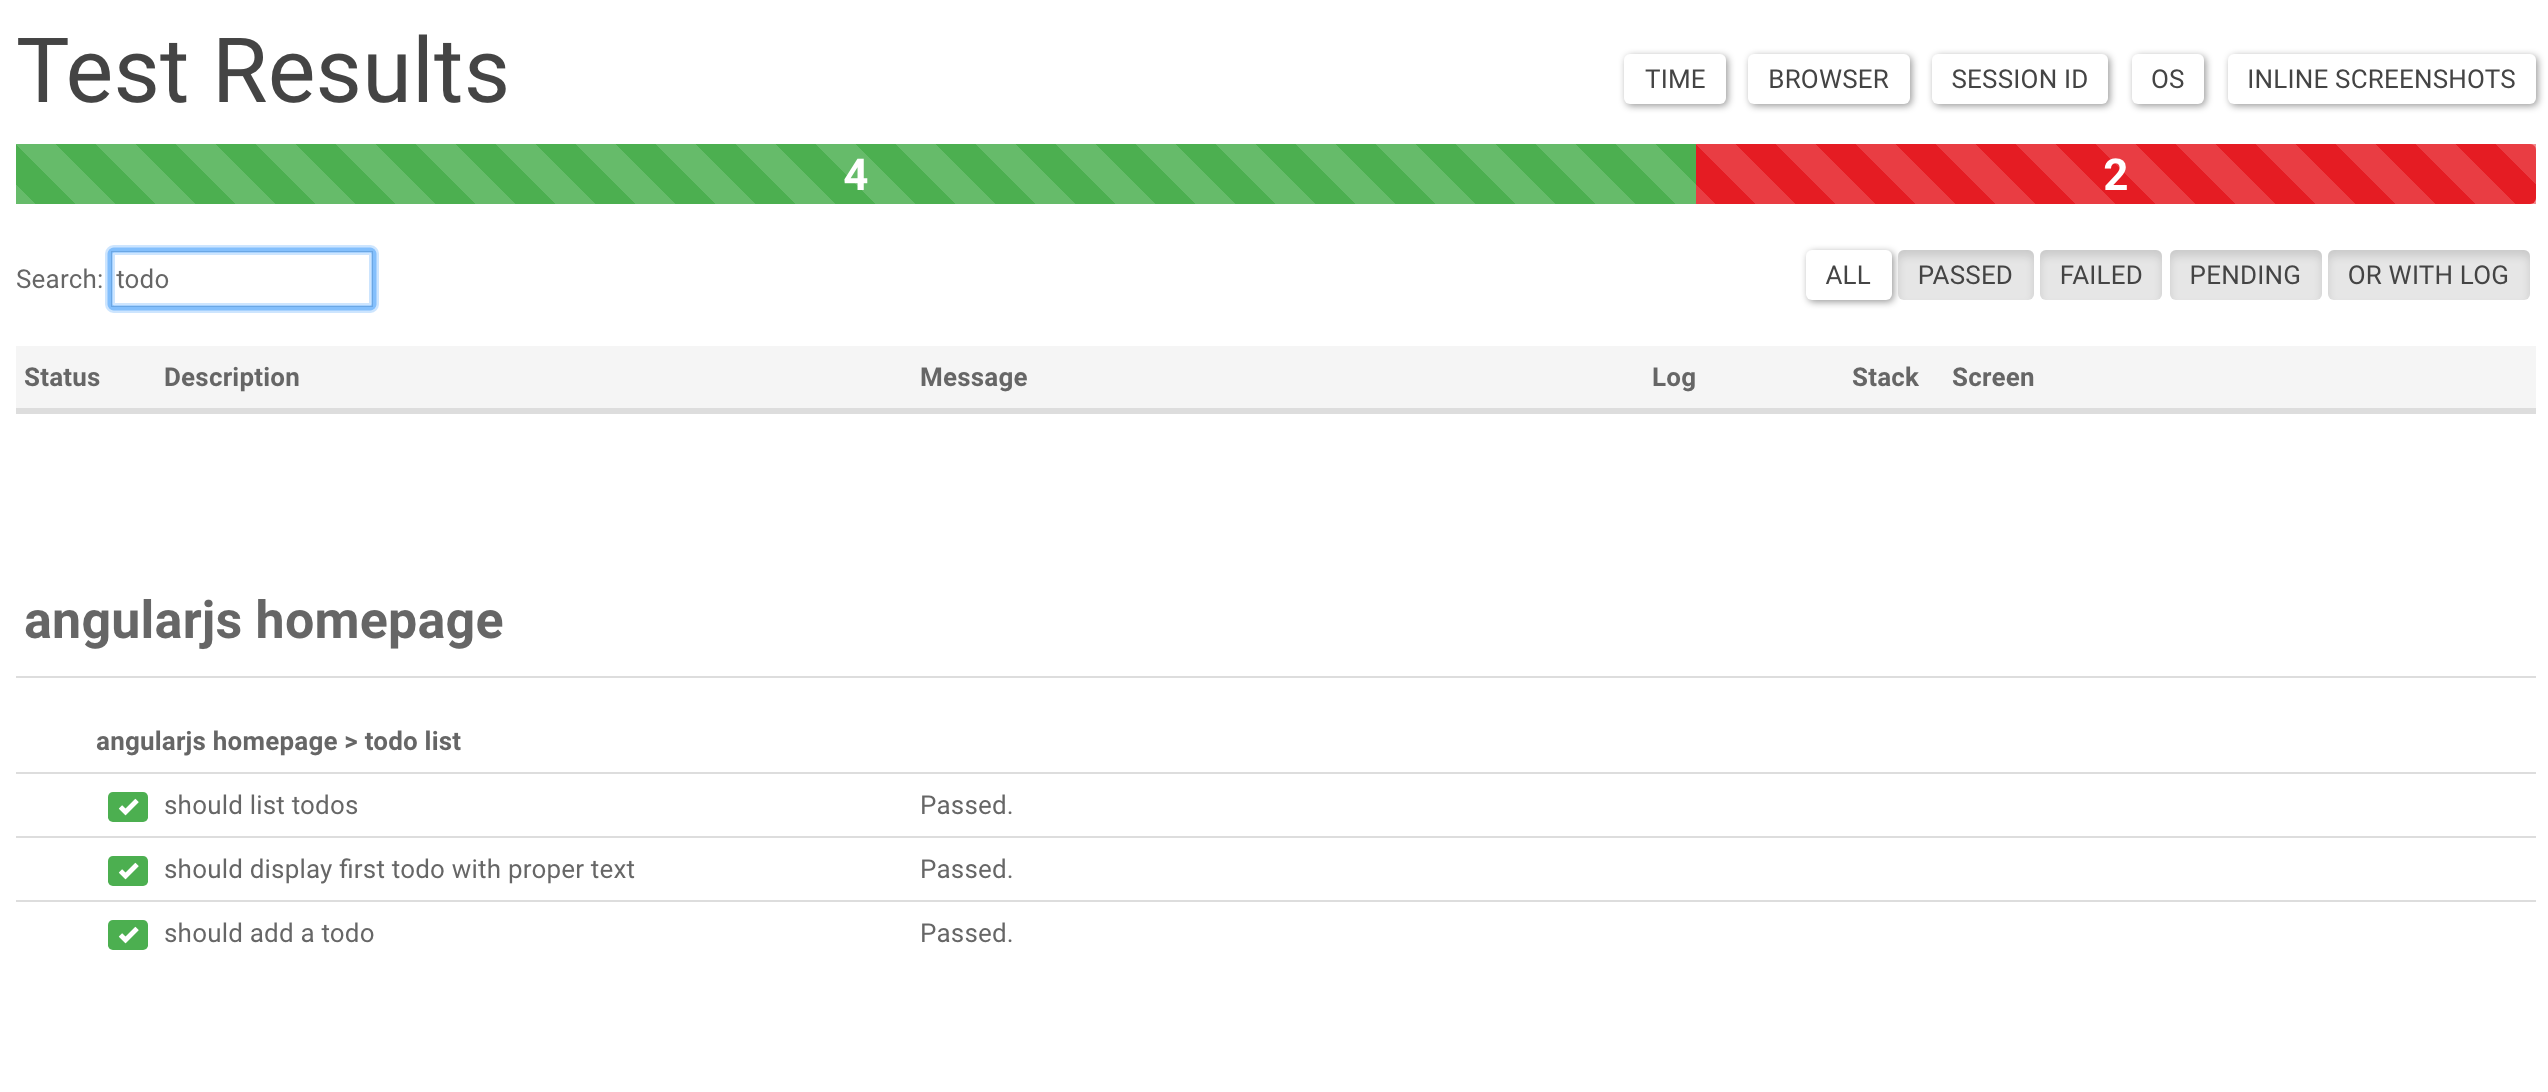
Click View Stacktrace to see details of the error (if the test failed). Suspected line is highlighted.
Click View Browser Log to see Browser Log (collects browser logs also from passed tests)
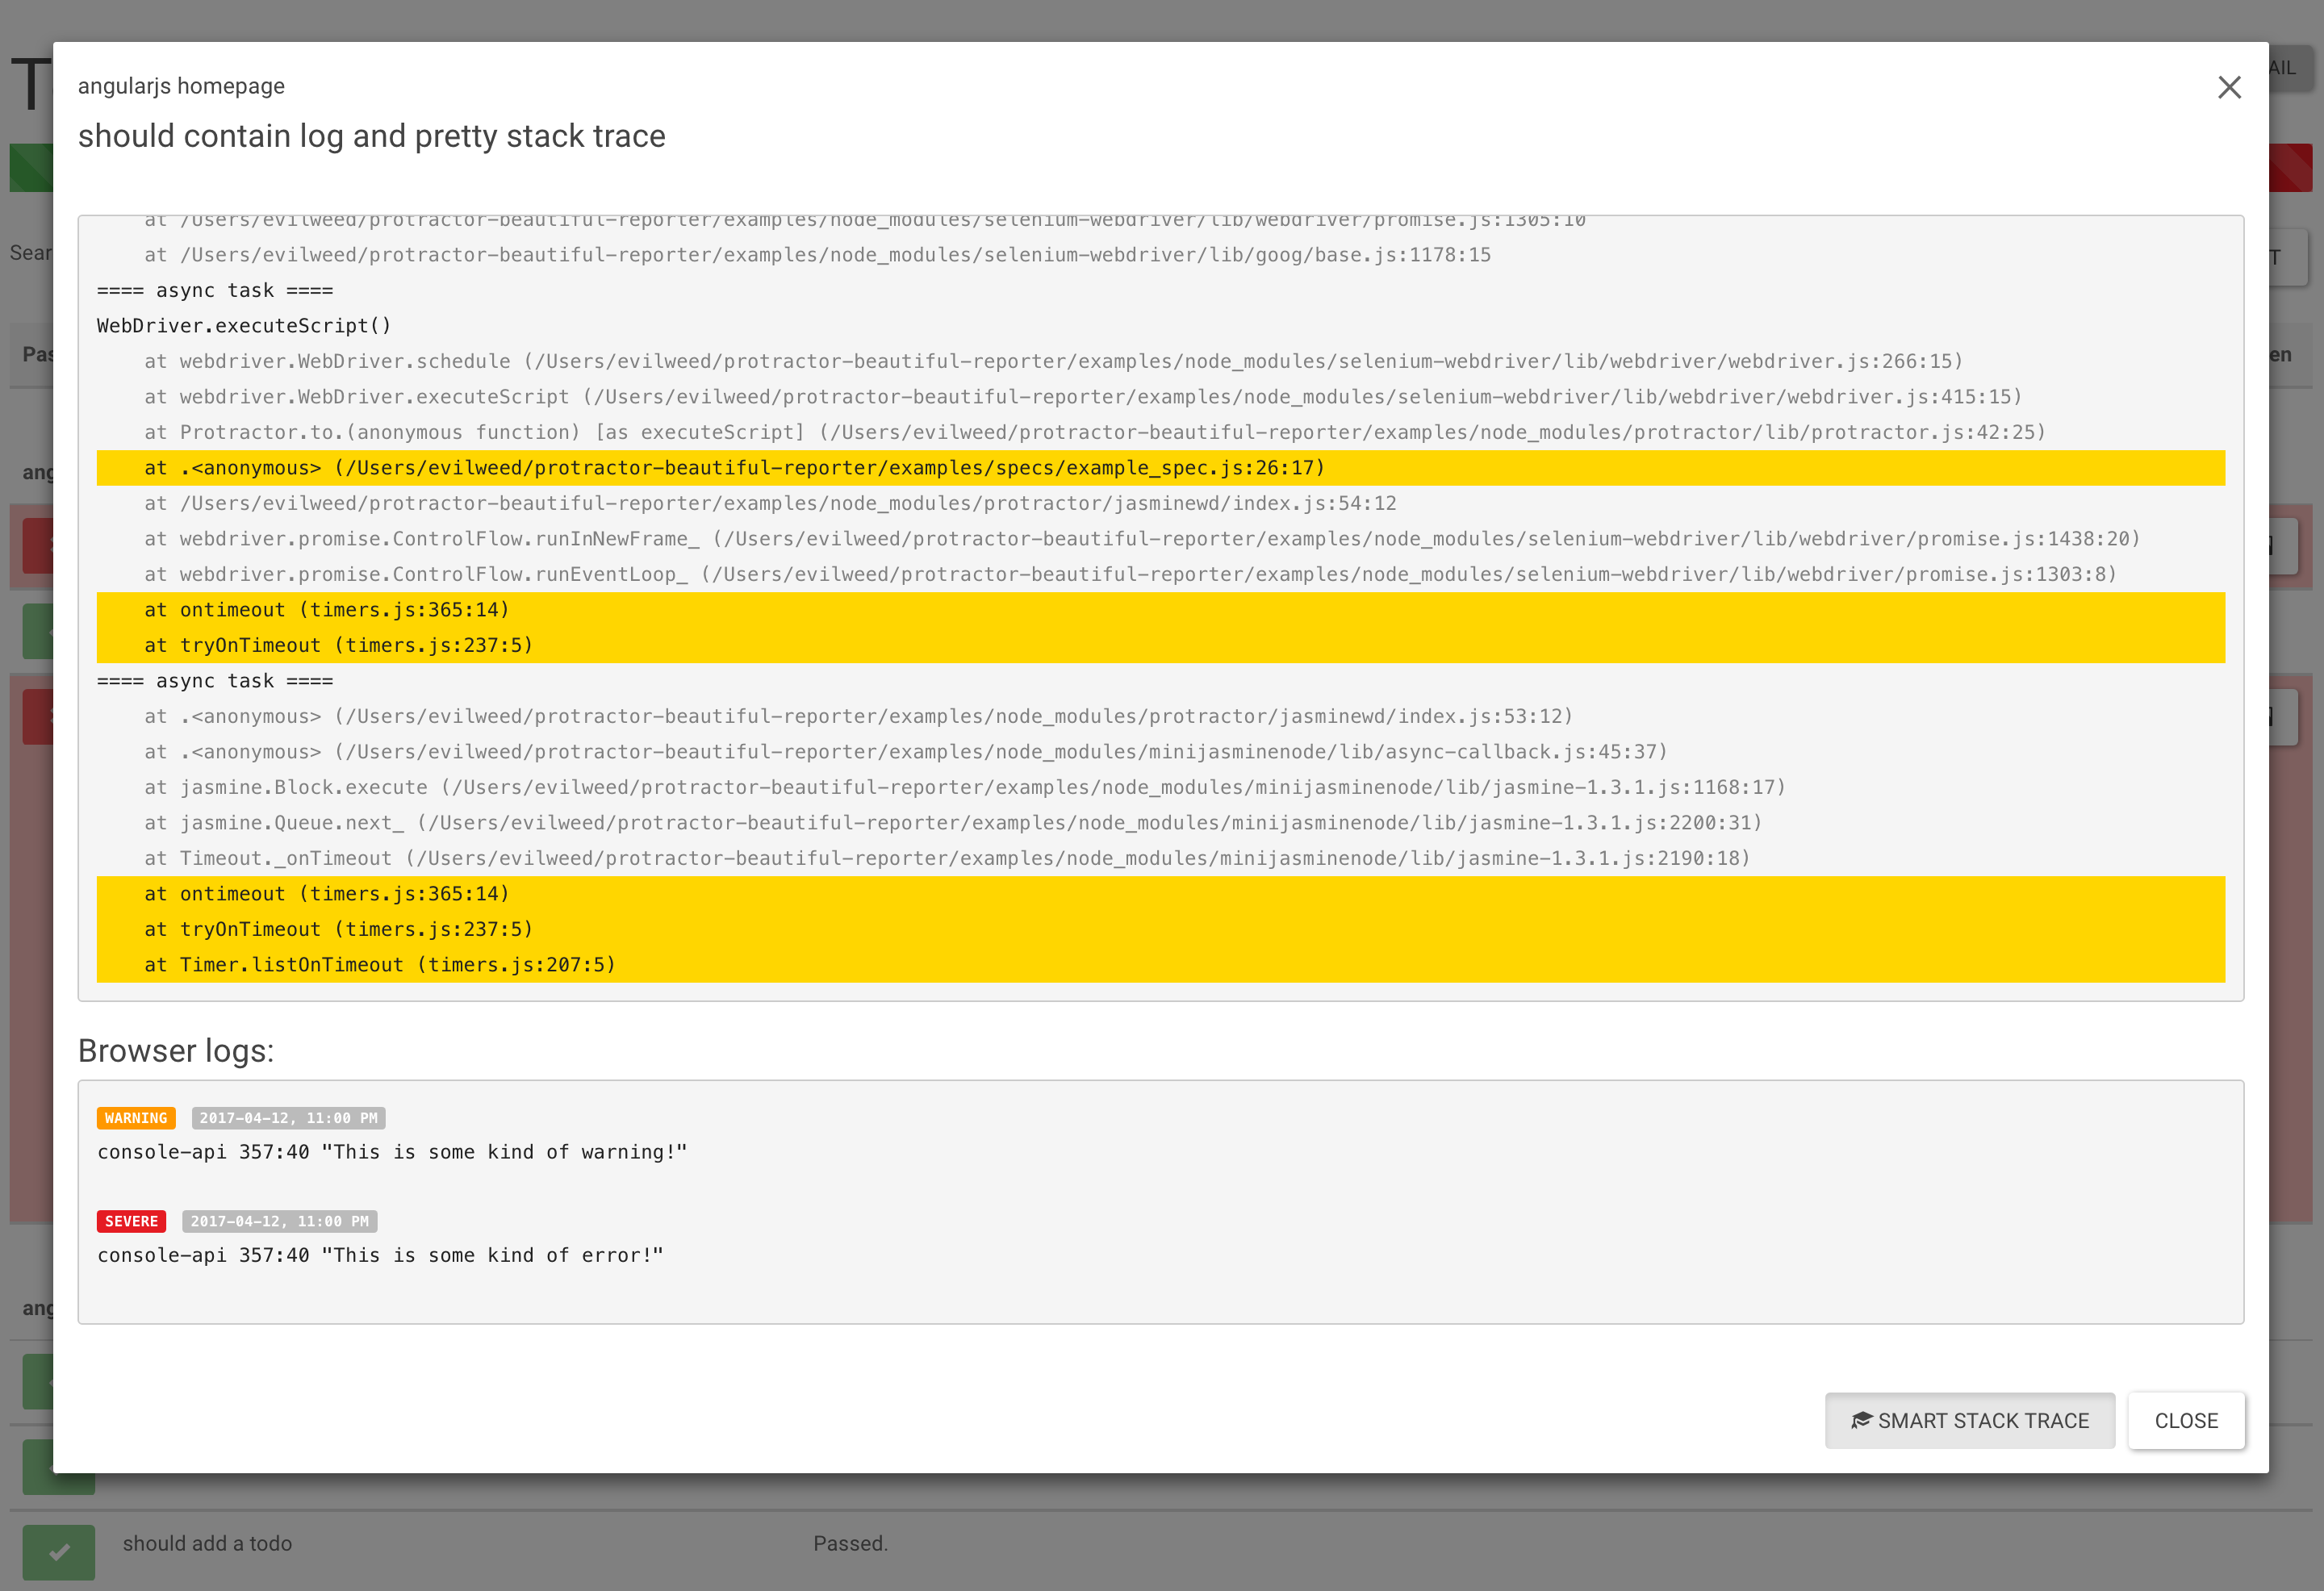
Click View Screenshot to see an image of the webpage at the end of the test.
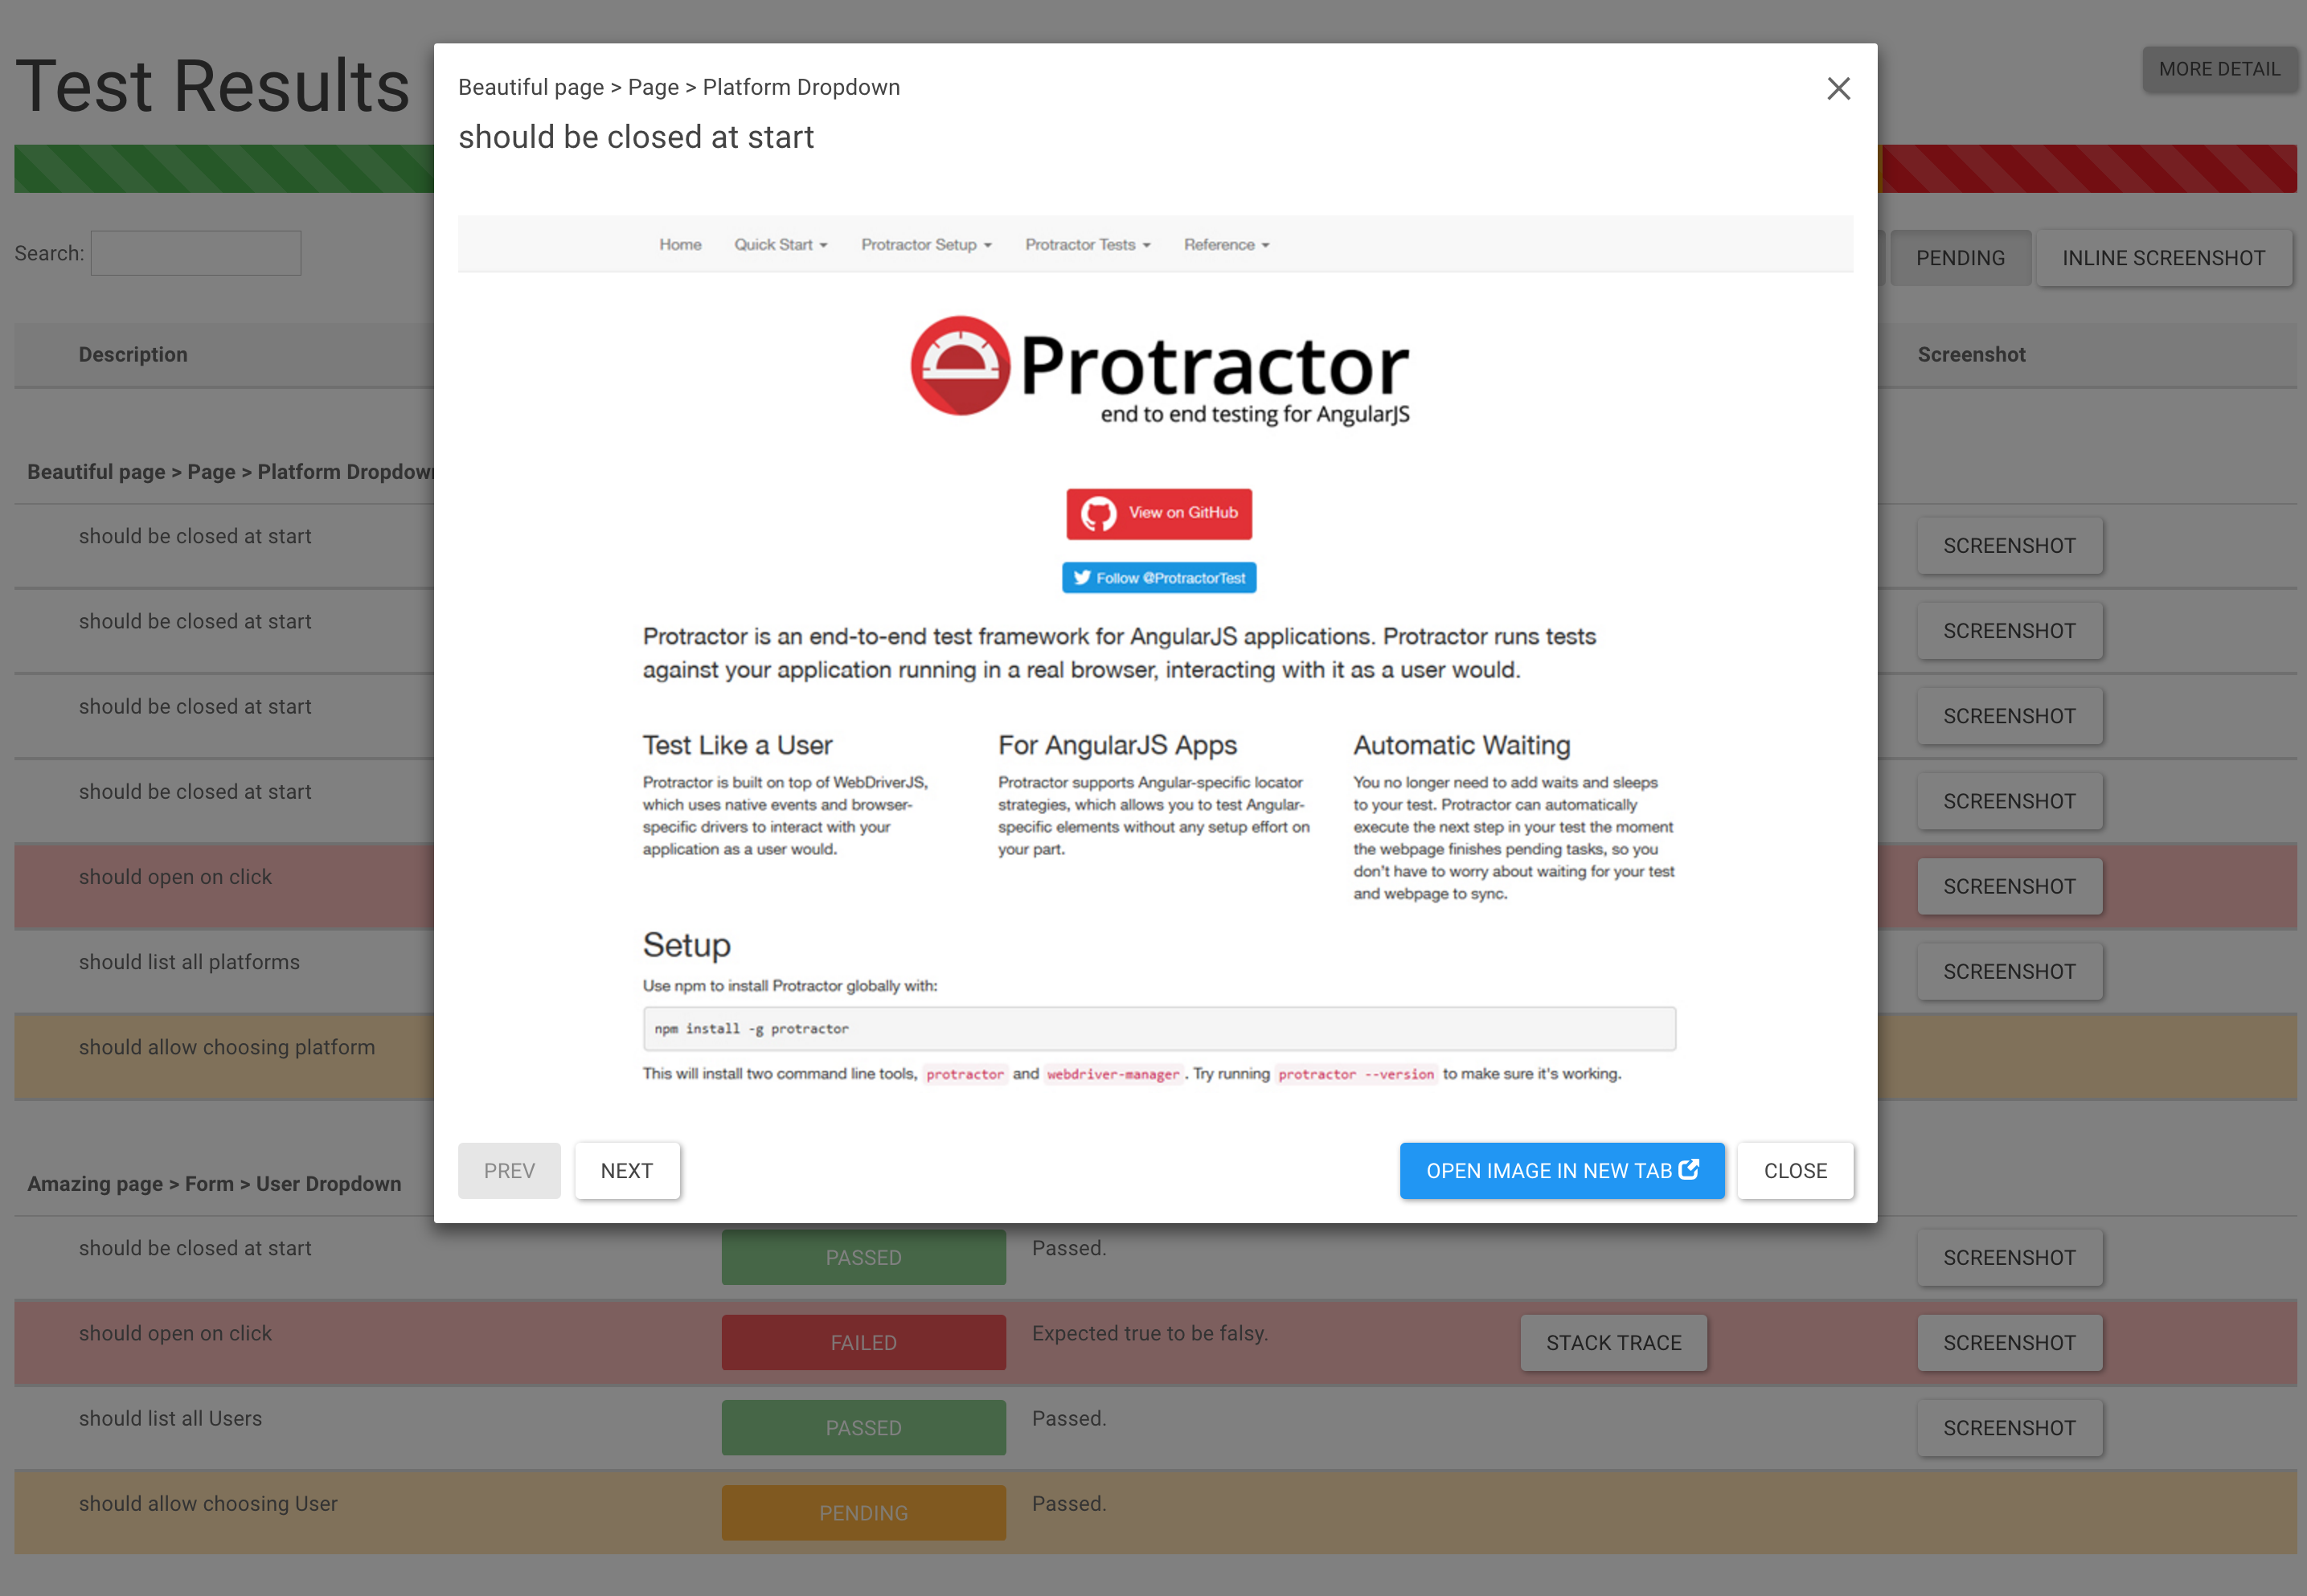
Click Inline Screenshots to see an inline screenshots in HTML report.
Please see the examples folder for sample usage.
To run the sample, execute the following commands in the examples folder
1
2$ npm install
3$ protractor protractor.conf.js
After the test run, you can see that, a screenshots folder will be created with all the reports generated.
You like it? You can buy me a cup of coffee/glass of beer :)
Copyright (c) 2017 Marcin Cierpicki zycienawalizkach@gmail.com
Permission is hereby granted, free of charge, to any person obtaining a copy of this software and associated documentation files (the "Software"), to deal in the Software without restriction, including without limitation the rights to use, copy, modify, merge, publish, distribute, sublicense, and/or sell copies of the Software, and to permit persons to whom the Software is furnished to do so, subject to the following conditions:
The above copyright notice and this permission notice shall be included in all copies or substantial portions of the Software.

No vulnerabilities found.
Reason
no binaries found in the repo
Reason
0 existing vulnerabilities detected
Reason
license file detected
Details
Reason
0 commit(s) and 0 issue activity found in the last 90 days -- score normalized to 0
Reason
Found 1/18 approved changesets -- score normalized to 0
Reason
no effort to earn an OpenSSF best practices badge detected
Reason
security policy file not detected
Details
Reason
project is not fuzzed
Details
Reason
branch protection not enabled on development/release branches
Details
Reason
SAST tool is not run on all commits -- score normalized to 0
Details
Score
Last Scanned on 2024-11-25
The Open Source Security Foundation is a cross-industry collaboration to improve the security of open source software (OSS). The Scorecard provides security health metrics for open source projects.
Learn More