Gathering detailed insights and metrics for hermes-profile-transformer
Gathering detailed insights and metrics for hermes-profile-transformer
Gathering detailed insights and metrics for hermes-profile-transformer
Gathering detailed insights and metrics for hermes-profile-transformer
TypeScript tool for converting Hermes Sampling Profiler output to Chrome Dev Tools format
npm install hermes-profile-transformerTypescript
Module System
Min. Node Version
99
Supply Chain
95.4
Quality
80.5
Maintenance
100
Vulnerability
99.6
License
TypeScript (100%)
Total Downloads
225,806,206
Last Day
155,878
Last Week
919,327
Last Month
4,339,854
Last Year
65,119,076
MIT License
88 Stars
96 Commits
10 Forks
7 Watchers
15 Branches
69 Contributors
Updated on Apr 07, 2025
Latest Version
0.0.9
Package Id
hermes-profile-transformer@0.0.9
Size
68.72 kB
Published on
Aug 20, 2020
Cumulative downloads
Total Downloads
Last Day
30.8%
155,878
Compared to previous day
Last Week
19.6%
919,327
Compared to previous week
Last Month
-3%
4,339,854
Compared to previous month
Last Year
-8%
65,119,076
Compared to previous year
1
4


Visualize Facebook's Hermes JavaScript runtime profile traces in Chrome Developer Tools.
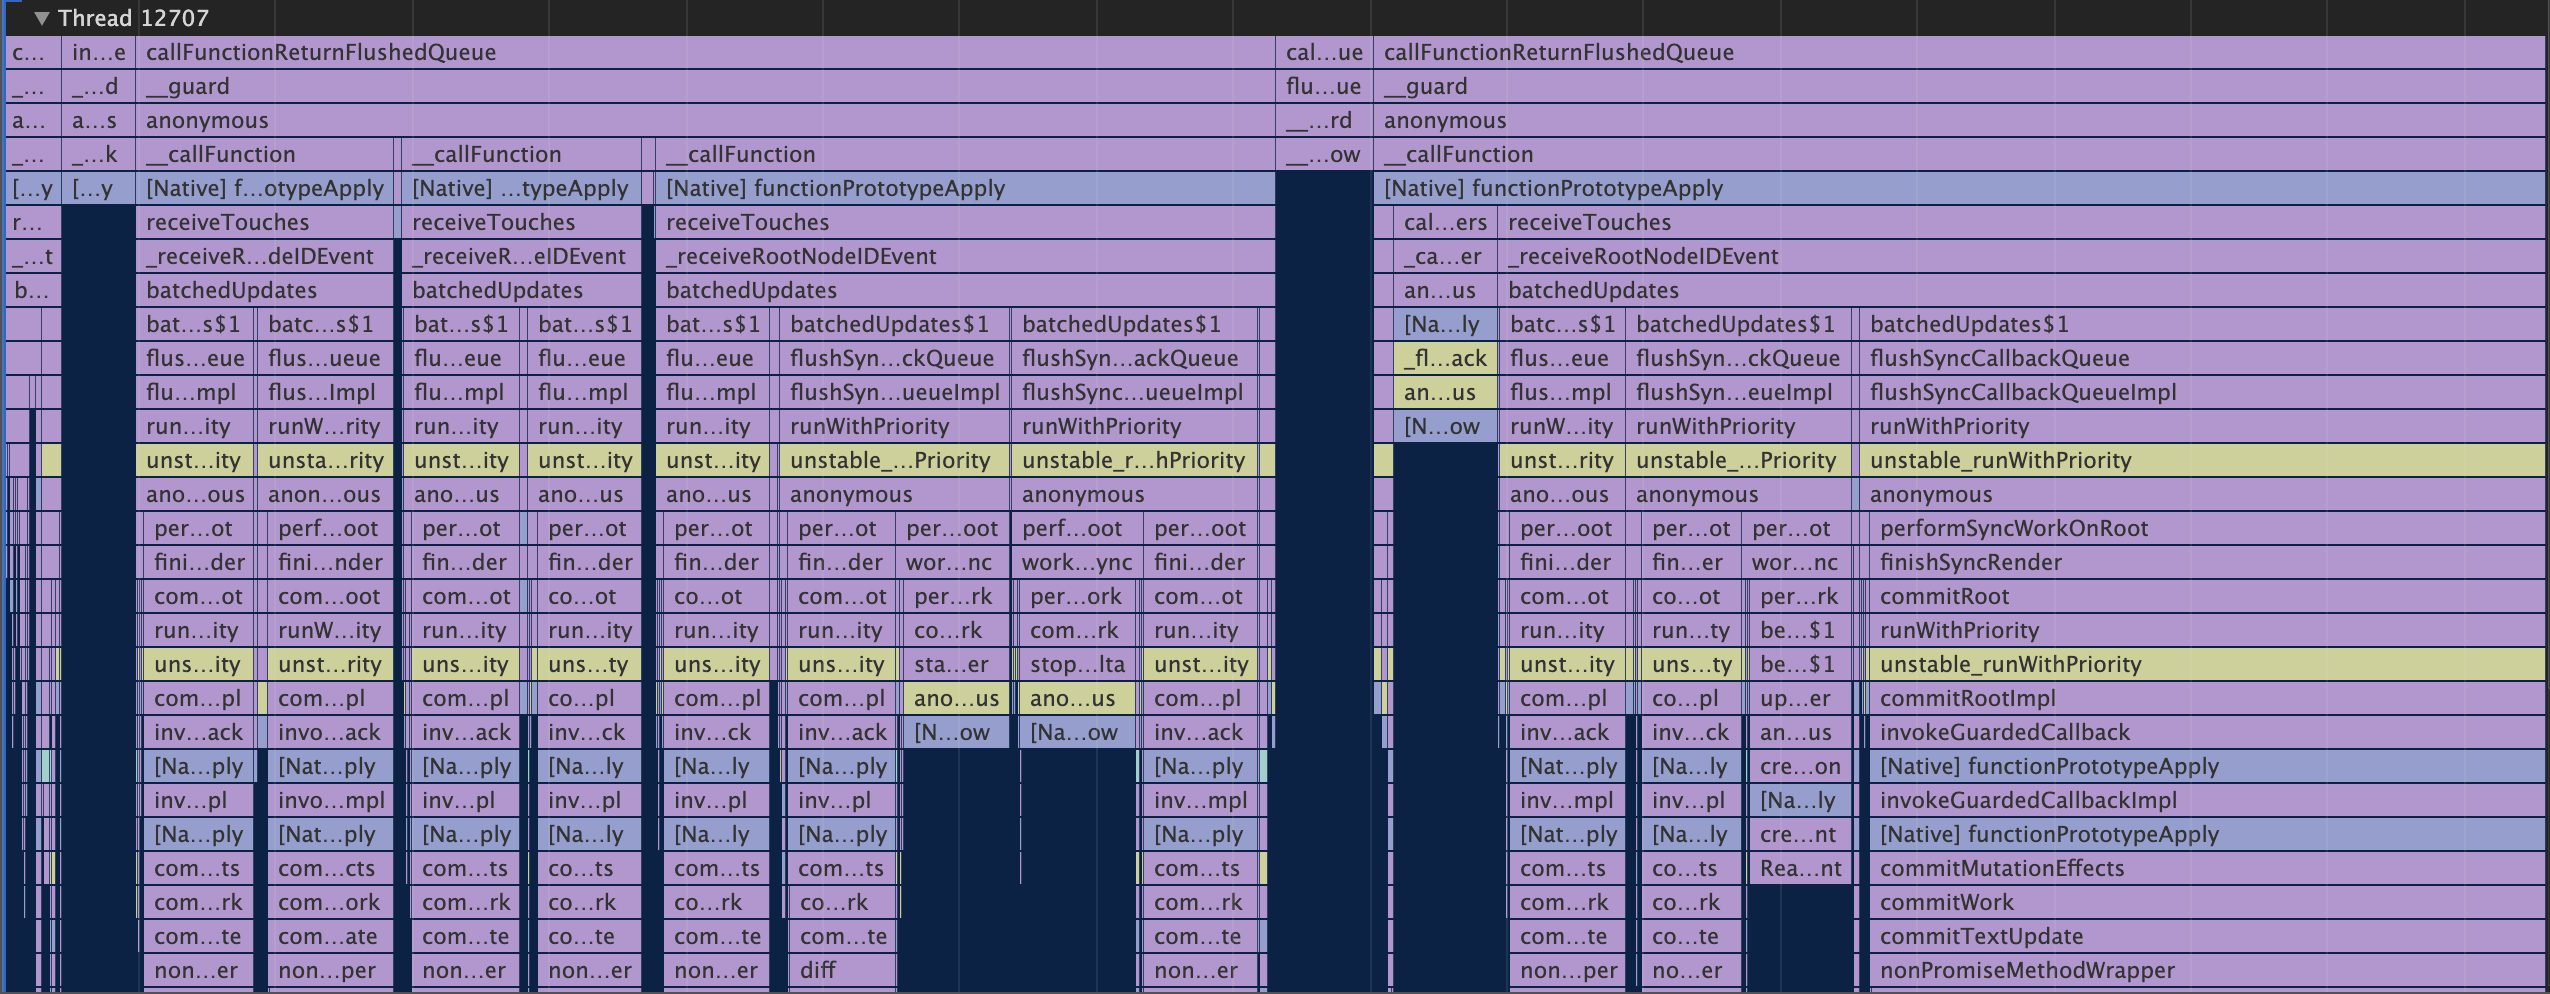
The Hermes runtime, used by React Native for Android, is able to output Chrome Trace Events in JSON Object Format.
This TypeScript package converts Hermes CPU profiles to Chrome Developer Tools compatible JSON Array Format, and enriches it with line and column numbers and event categories from JavaScript source maps.
If you're using hermes-profile-transformer to debug React Native Android applications, you can use the React Native CLI react-native profile-hermes command, which uses this package to convert the downloaded Hermes profiles automatically.
1const transformer = require('hermes-profile-transformer').default;
2const { writeFileSync } = require('fs');
3
4const hermesCpuProfilePath = './testprofile.cpuprofile';
5const sourceMapPath = './index.map';
6const sourceMapBundleFileName = 'index.bundle.js';
7
8transformer(
9  // profile path is required
10  hermesCpuProfilePath,
11  // source maps are optional
12  sourceMap,
13  sourceMapBundleFileName
14)
15  .then(events => {
16    // write converted trace to a file
17    return writeFileSync(
18      './chrome-supported.json',
19      JSON.stringify(events, null, 2),
20      'utf-8'
21    );
22  })
23  .catch(err => {
24    console.log(err);
25  });
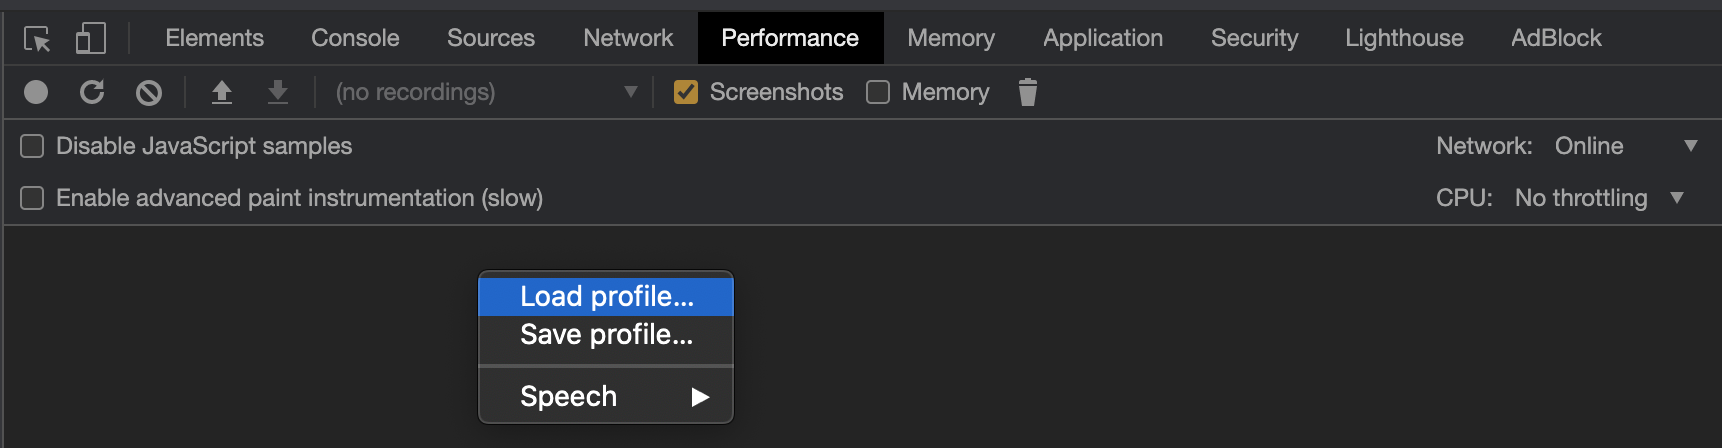
Open Developer Tools in Chrome, navigate to the Performance tab, and use the Load profile... feature.
| Parameter | Type | Required | Description |
|---|---|---|---|
| profilePath | string | Yes | Path to a JSON-formatted .cpuprofile file created by the Hermes runtime |
| sourceMapPath | string | No | Path to a source-map compatible Source Map file |
| bundleFileName | string | No | If sourceMapPath is provided, you need to also provide the name of the JavaScript bundle file that the source map applies to. This file does not need to exist on disk. |
Promise<DurationEvent[]>, where DurationEvent is as defined in EventInterfaces.ts.

No vulnerabilities found.
Reason
no binaries found in the repo
Reason
no dangerous workflow patterns detected
Reason
license file detected
Details
Reason
Found 2/15 approved changesets -- score normalized to 1
Reason
0 commit(s) and 0 issue activity found in the last 90 days -- score normalized to 0
Reason
detected GitHub workflow tokens with excessive permissions
Details
Reason
dependency not pinned by hash detected -- score normalized to 0
Details
Reason
no effort to earn an OpenSSF best practices badge detected
Reason
project is not fuzzed
Details
Reason
security policy file not detected
Details
Reason
SAST tool is not run on all commits -- score normalized to 0
Details
Reason
37 existing vulnerabilities detected
Details
Score
Last Scanned on 2025-07-07
The Open Source Security Foundation is a cross-industry collaboration to improve the security of open source software (OSS). The Scorecard provides security health metrics for open source projects.
Learn More